Solved

Time between "new" user and conversion to event (subscribe)

  • 1 December 2022
  • 9 replies
  • 184 views

Badge

Hey,

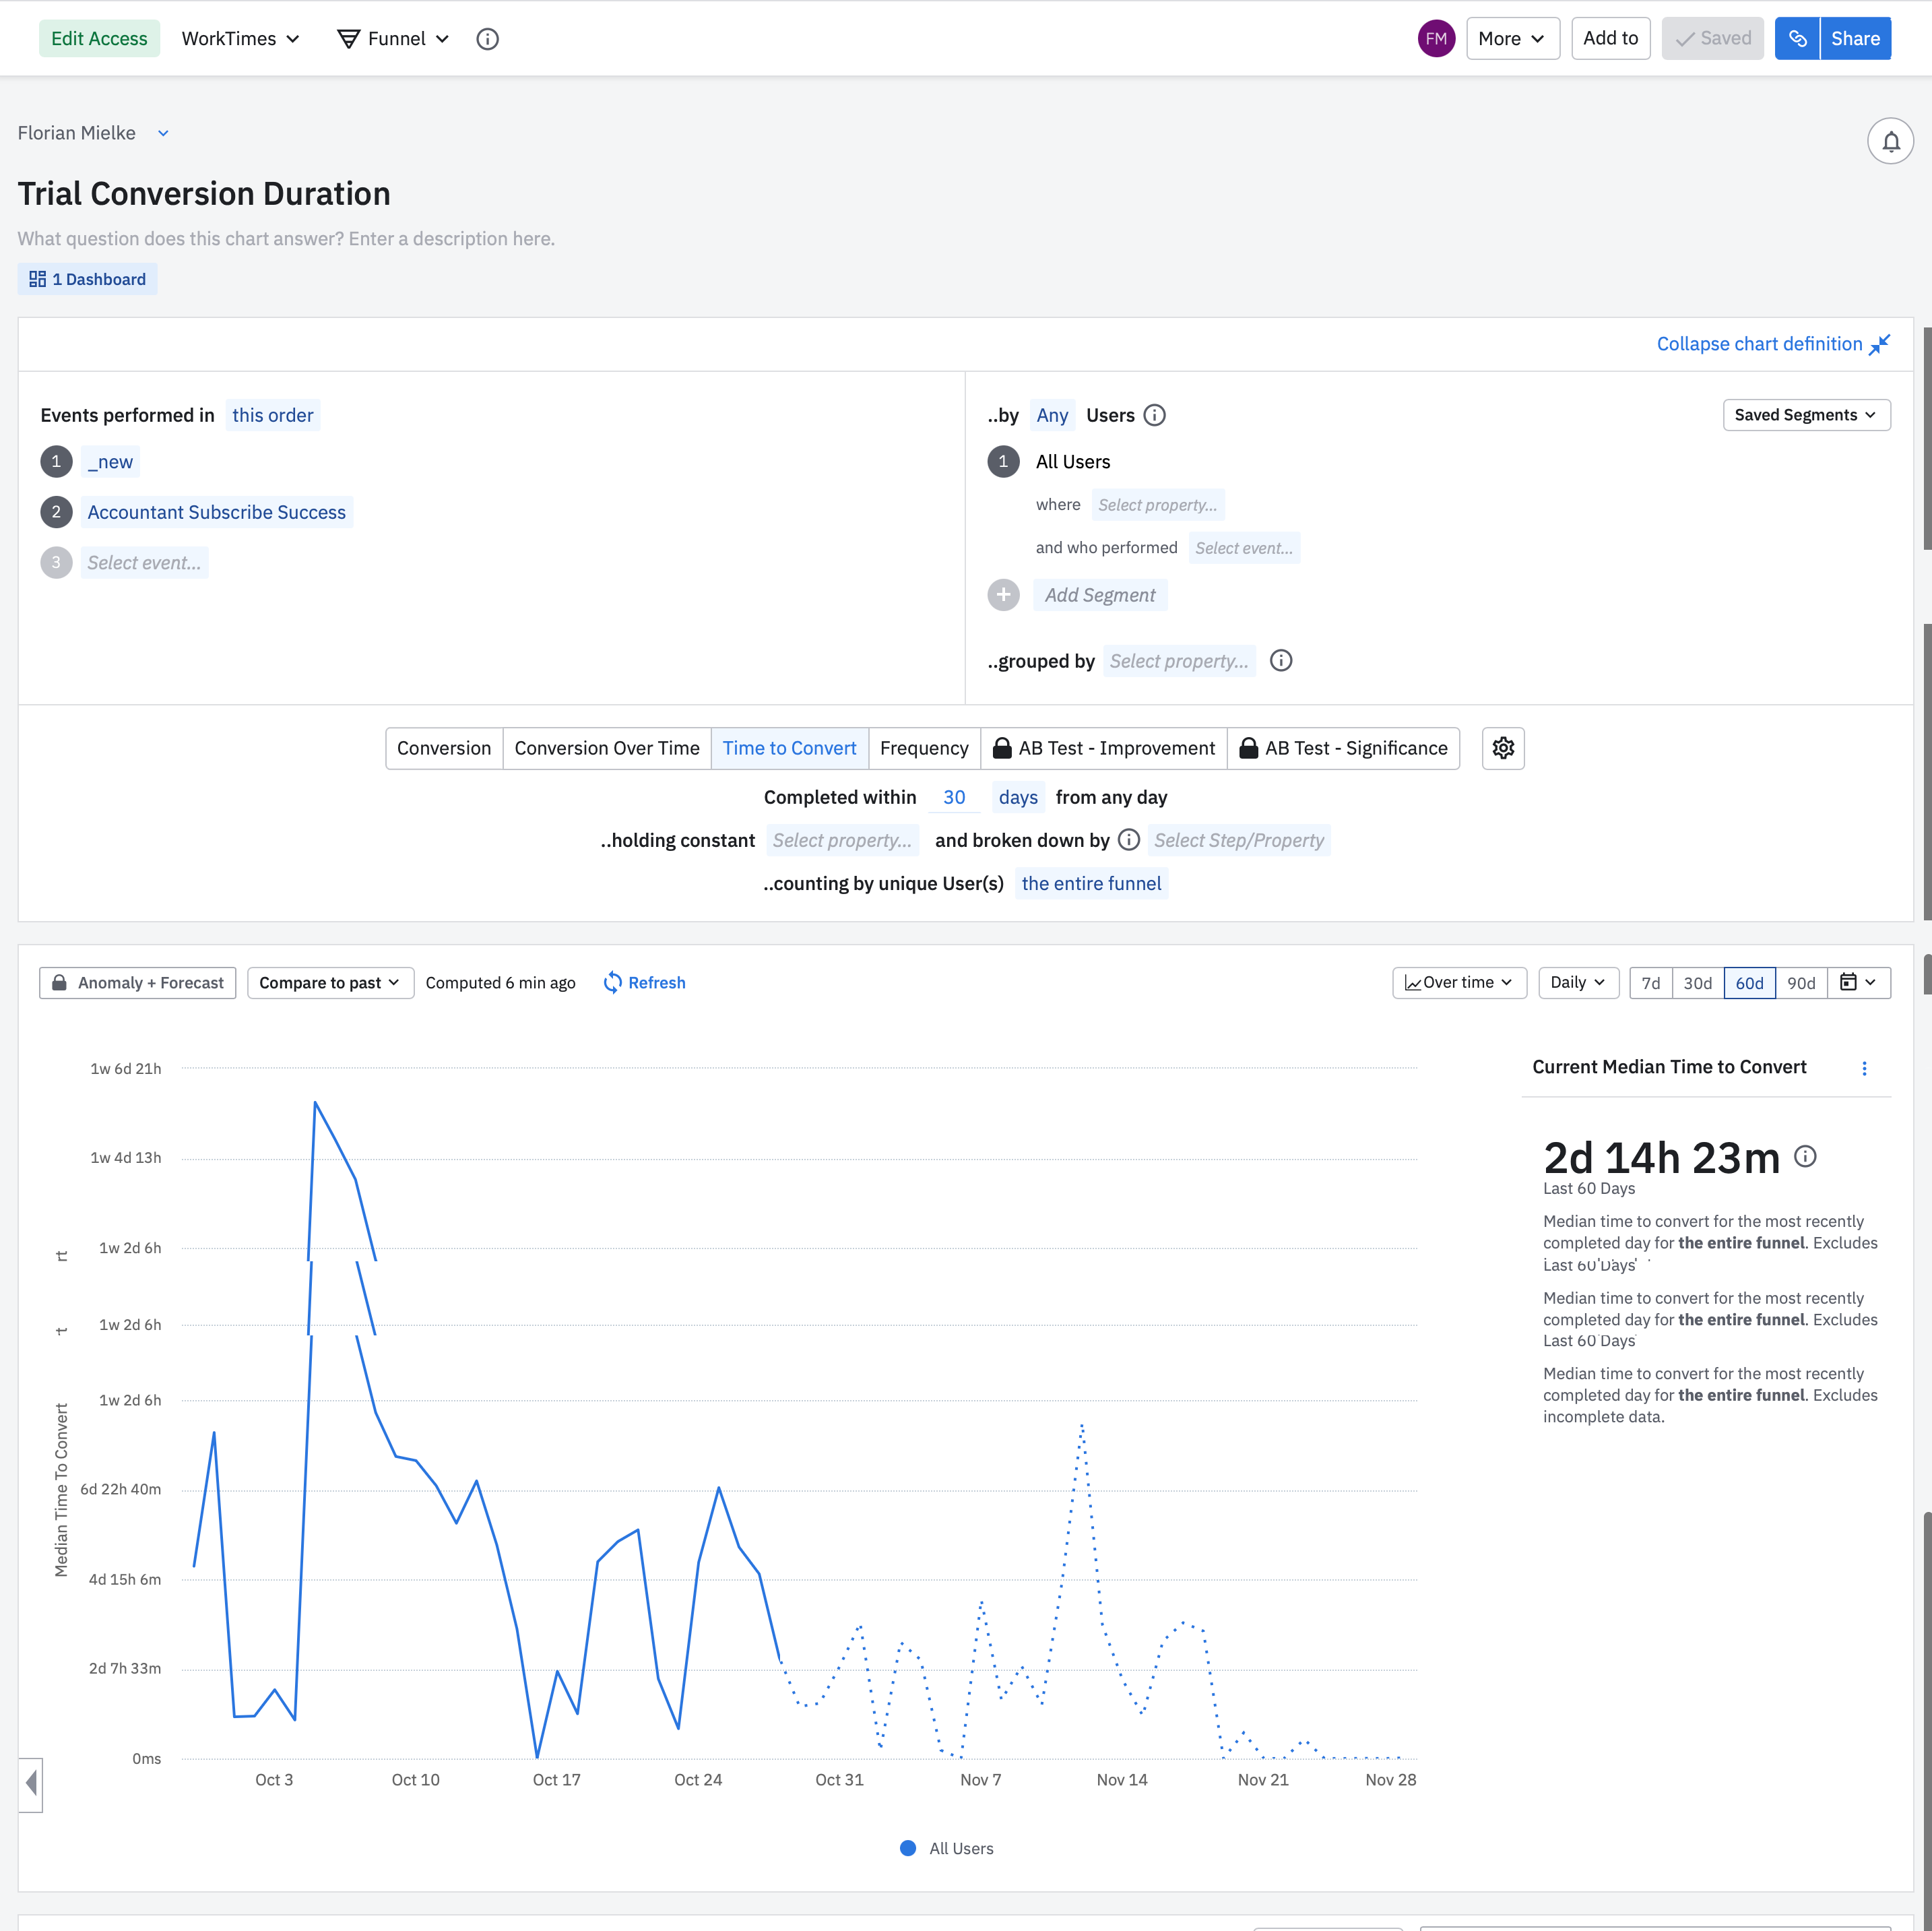
I’d like to analyze the average time between a new user being “first seen” in Amplitude and the subscribe event (if any).

I’ve set up a funnel, but I am unsure if I set the correct parameter.

Any suggestions?


Please ignore the glitch in the chart. That was due to an issue with the screen capturing + scrolling. 🤷‍♂️


icon

Best answer by Denis Holmes 2 December 2022, 12:21

View original

9 replies

Userlevel 6
Badge +8

Hi @florianmielke ,


Thanks for writing into the Community! In this instance, your chart does seem ideal. As long as you are confident that users can only trigger this _new event once or on their first day only. Then the above should work as it looks for all users who did this _new event to subscribe and then we can see the average time to convert for users day to day. I would say this is correct, do you want any help reading some of the data? If so, can you share the chart URL? I will be able to access it and see. Thank you!


Kind Regards,
Denis

Badge

Hi @Denis Holmes,

Thanks for your answer.

I grabbed the _new event from a chart from the Feature KPI template you provided. So it’s not an event I’ve created.

Here is the link: https://analytics.amplitude.com/madefm/chart/1lhk42u?source=copy+url

Or do I have to create a public link so you can access it?


Thanks in advance,

Florian

Userlevel 6
Badge +8

Hi @florianmielke ,


Can you let me know where exactly you got the Feature KPI Template? However, the chart does look good and this will show anyone who did the second event within 30 days of being a newly tracked user and you are looking at that over a 60 day period. Does that help?

Kind Regards,
Denis

Badge

Hi @Denis Holmes,

Thanks again. Yes, that helps is exactly what I was looking for. 👍

Unfortunately, I couldn’t create new charts from the templates today. I’ve always been forwarded to my “Home” page after tapping the Template button. Seems like a bug in the latest release.

One last question: I couldn’t select that _new event when creating new charts myself. Is there a trick how to do that without going through the templates?

Userlevel 6
Badge +8

Hi @florianmielke ,

So I believe what has happened here is you had access to a template chart where New User was being used, and then you changed this chart to Funnel, which does not take the New User event. Therefore, it was copied over (unintentionally) and so you now see this _new which should not happen in Funnel. If you want to use New User in a chart, you can just create the chart directly and you should then be able to use the New user event in Retention and Event Seg charts! 


Kind Regards,
Denis

Badge

Hi @Denis Holmes,

I did not change the type of the chart to Funnel. It was by default. Unfortunately, I’m still not able to access the Templates.

I’m unsure how to use the Retention or Segmentation chart to get the time between a “first-seen” user and the subscribe event. Any hints on that?

Userlevel 6
Badge +8

Hi @florianmielke,


Can you send me your Org ID and email you use for Amplitude? We will have to investigate further so I would like to make a ticket, thank you. 


Kind Regards,
Denis

Badge

Just sent you a DM.

@Denis Holmes -- I have this same question and unfortunately the responses in this thread are not helpful for future users coming across this via search as there’s no public resolution to the initial question.

I’m attempting to build a dashboard for high level visibility of Time-to-Value (TTV) metrics for various verticals in our product.  Ideally, I would like to be able to add a KPI metric (or a visualization if a metric isn’t possible) of the average time it takes for new users to complete a given conversion event.

For example, the average time it takes for a new users identified in Amplitude to when those users trigger a hypothetical “Onboarding Completed” event.

How can this be done in Amplitude?

Reply