This is a common question we get in our support tickets! Allow me to explain. When looking at the Retention chart values versus the breakdown chart values it is important to note two things:
-
The chart values will be a deduplicated number of users from the breakdown table
-
Incomplete data points are not included in the chart values
I will elaborate on both points below!
Retention chart values are deduplicated breakdown chart users
The chart values on a Retention Analysis chart will be the top row of percentages in the breakdown table which is highlighted in the picture below. These values are the number of unique users who have performed the return event at day X out of the total number of unique users who have completed day X. In other words this row is a weighted average percentage of the below row values.

This weighted average top row will deduplicate the users in the rows below. If there was a user who performed the first event and return event multiple times in the time frame that user is only counted once per numerator and denominator for the top row. The same user, however, can be included in multiple rows below in the breakdown table. For each day included in the time frame the user can perform the first event and return event. Each time the user will be counted in the below rows.
For example, if you reference the example chart above - the percentages in the rows below on day 2 look higher than the top row 16.1% weighted average. What’s happening here is that the values in the rows below the overall top row can include the same user more than once. In the breakdown table a user can perform the start event once on January 23rd and January 24th. The user will count once in each of those segments’ denominators on the breakdown table. Now let’s say the same user performs the return event within 2 days of January 23rd. Then, the user performed the return event again 2 days from January 24th. That user will now count in the day 2 numerator for each of those below rows on the breakdown table. That same user, however, will only count once for the overall top row day 2 calculation value of Retention. You can read more on how each row is calculated here.
Incomplete data points are not included in Retention chart values
Another thing to consider is that the weighted average does not include incomplete data points. If you expand your breakdown table, any value with an asterisk next to it is considered incomplete because the users have not passed x days since their first event.
If we again look at the day 2 column as an example, for this example the current date is February 1st 2020. The segments for January 29th and January 30th will not be included in the chart calculation because it has not been a full 2 days since today’s date:
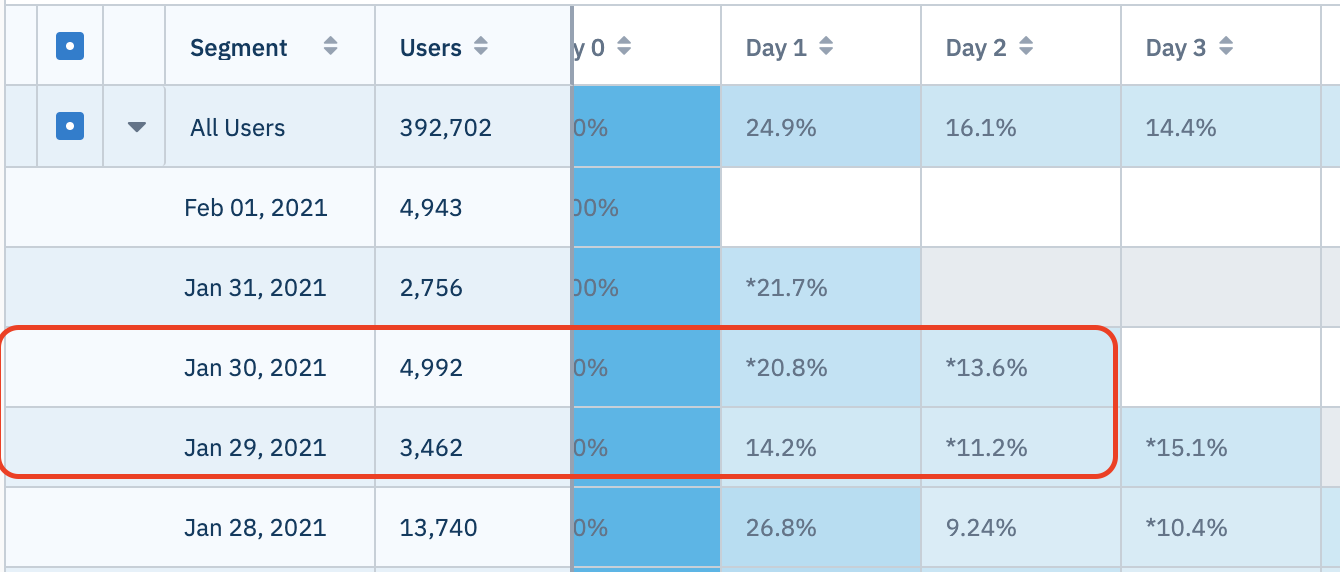
They are not included because we are looking at 24-hour windows on this chart. Users in each segment will have full 24-hour windows from their start event to count as converted. In the day 2 example users need to have had a full 48 hours to complete the Retention event and count as retained. The users in the January 29th and January 30th segments have not had 48 hours since their first event. They still have time to complete their Retention event. So they cannot be included in the weighted average calculation until 48 hours since their first event has passed.