Hi!
While analyzing the retention report, I came across different data in the same report:
1. Retention report says that there are 1,58% of users who came back on 26 day.
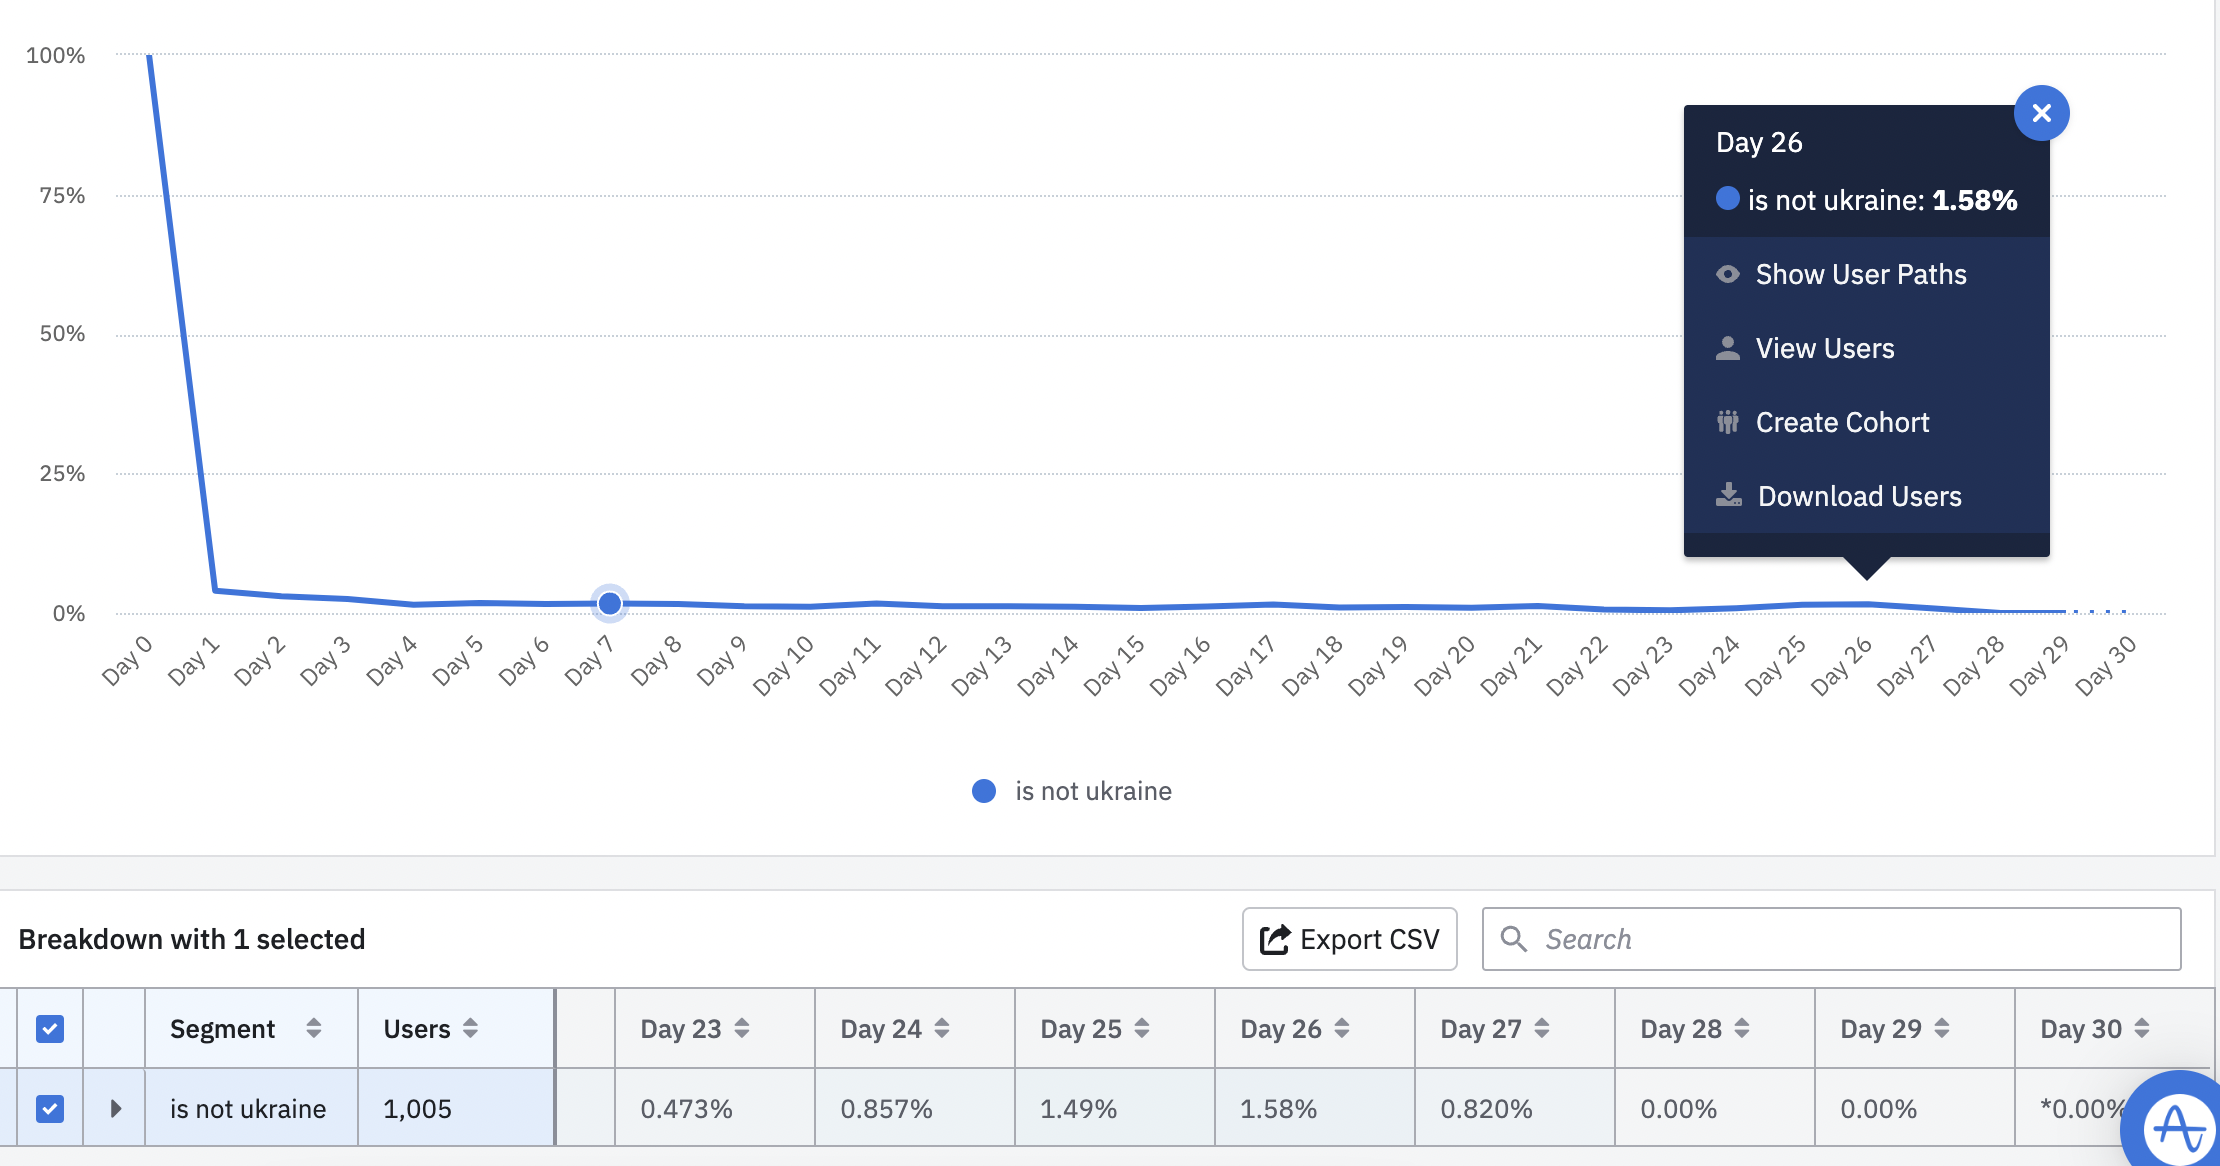
The numbers of users at cohort is 1005, so there should be 1005*1,58%=16 users who returned at day 26
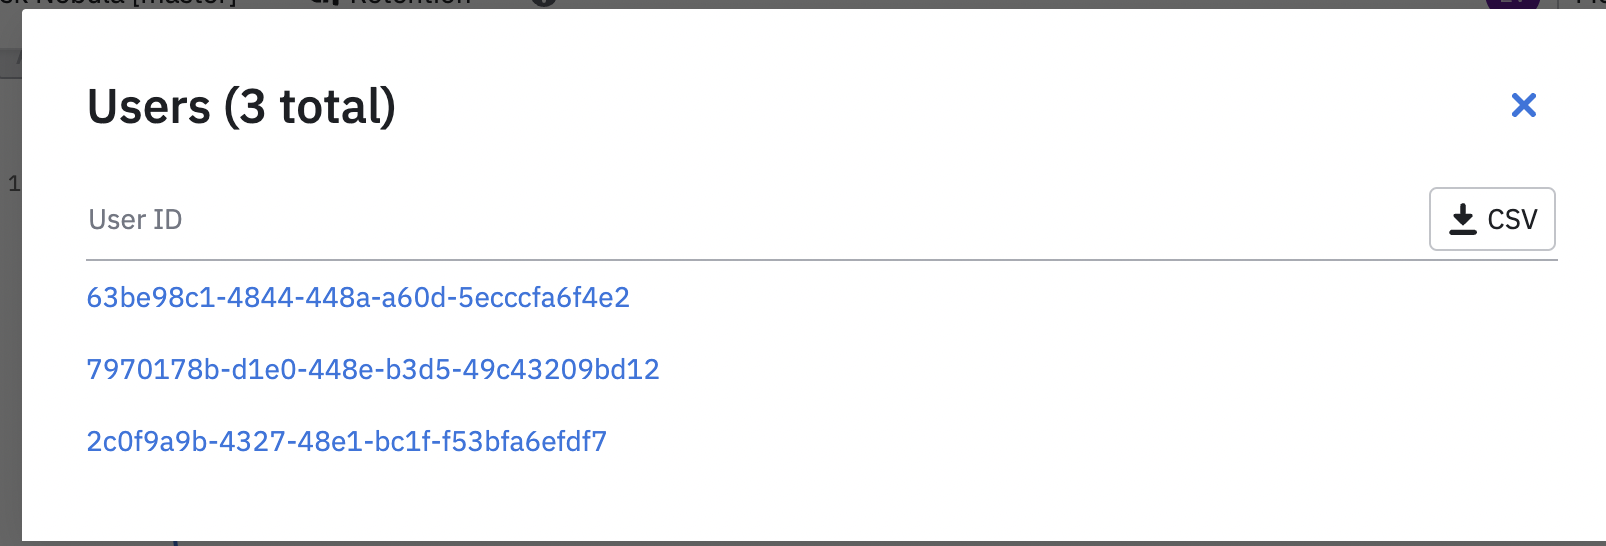
2. If i click at “view users” at day 26, i can see that there is only 3 users which is not the same as 16 at the previous bullet
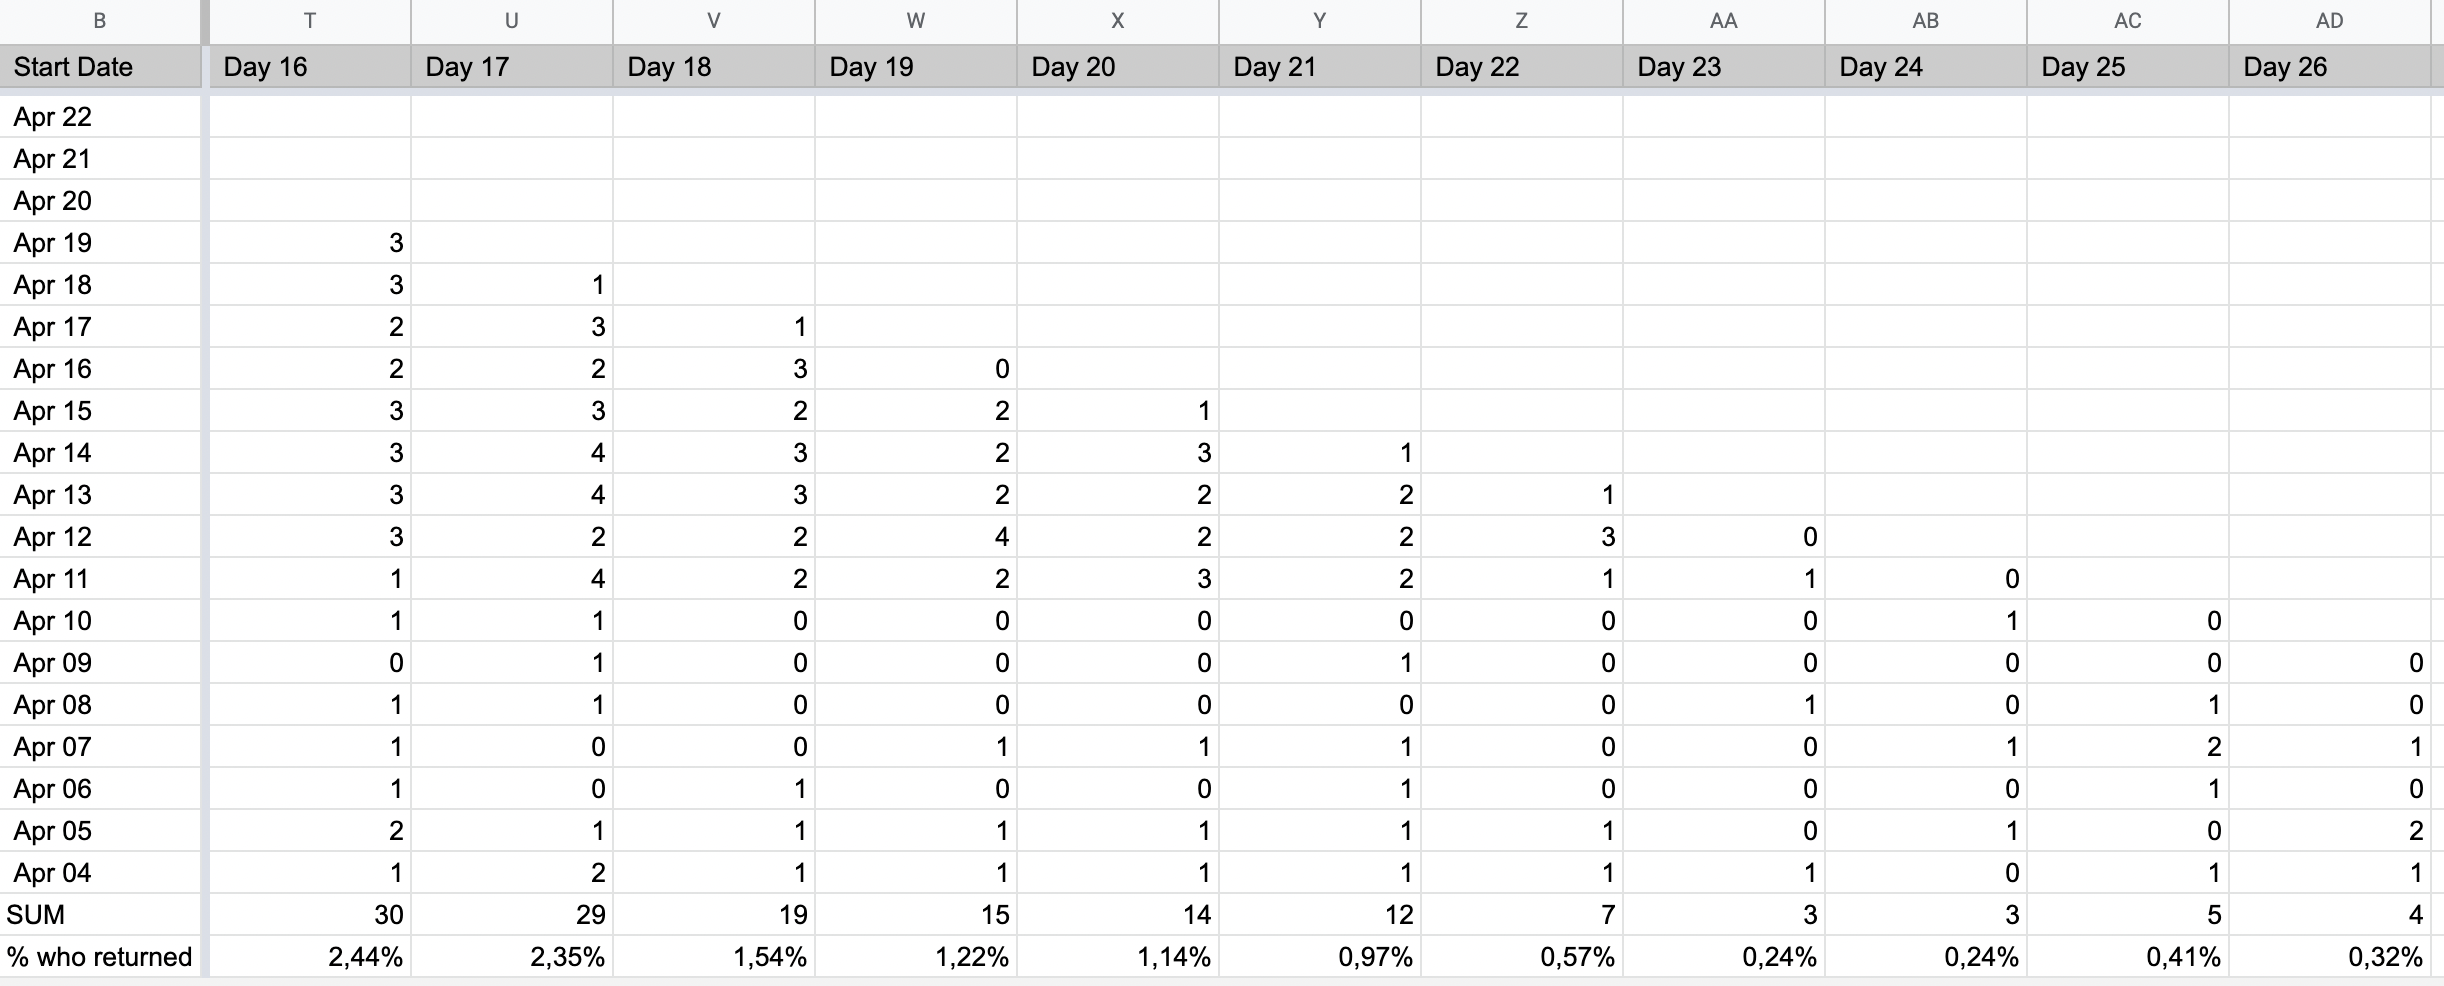
- If i download a CSV of that users and calculate retention, the number of returned users at d26 is 4 which is 0,32% from number of users at cohort (1232). Also number of users at cohort is different from the number on chart (1005 and 1232)
Which data is correct? If I’m analyzing that report in incorrect way, tell me which one is correct.
Thank you!