We’re building a mobile app. I’m trying to track % of users who quit the app at each step of our onboarding process.
I’m not 100% sure about what qualifies as a drop-off in the Funnel Analysis. My understanding is that whenever a user takes a path that’s different than the target funnel, it’s counted as a drop-off. However, here I’m only interested in paths that lead to and “End Session” event.
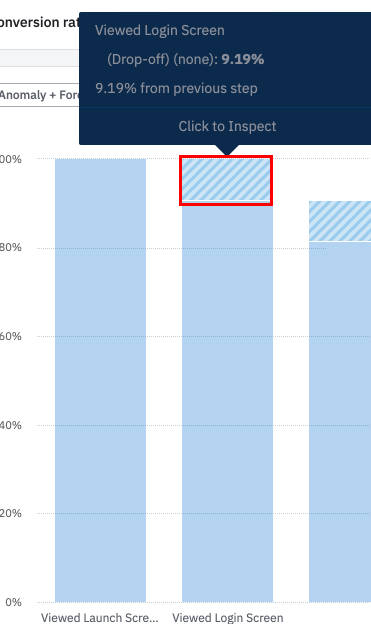
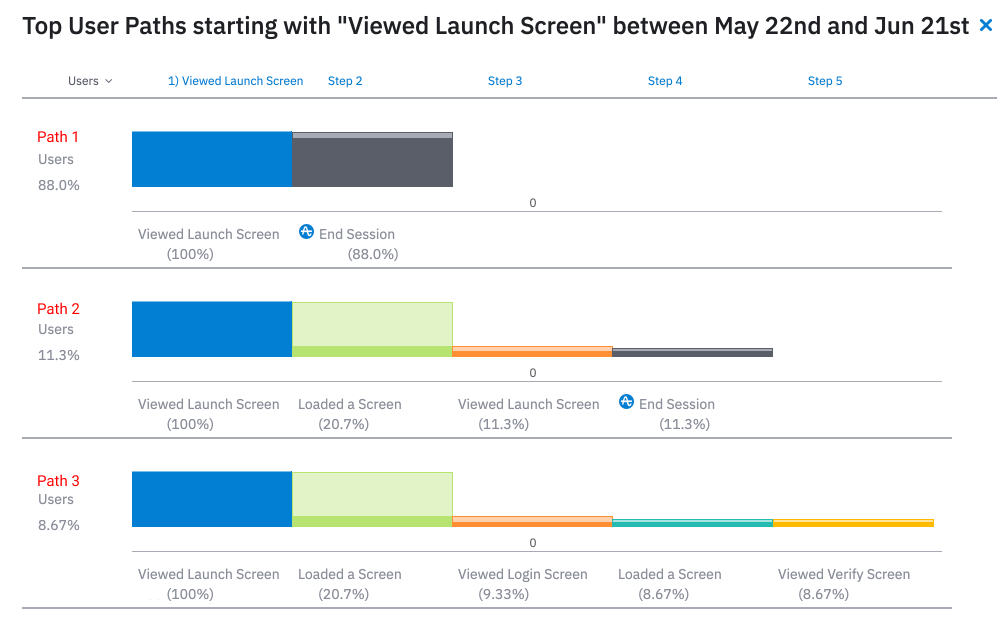
For example, let’s say I want to know % of users who leave the app after seeing our Login Screen. When looking at the next step in the Funnel Analysis, it will say 20% drop off from last step. So I was first assuming that 20% of users were quitting the app after seeing Login Screen. However, after looking into the different User Paths of the users dropping-off, I can see that only 70% of these paths are “Login Screen” → “End Session” paths. So basically the % of users leaving the app is just a fraction of the drop-off % showed in the funnel analysis. First, am I getting this right? Second, what would be the recommended method to track “End Session” drop-offs only?
Thank you!