I have a mobile app which has a Menu (like a resturant) showing all the different "Meals" next to eachother like a resturant or netflix menu.
User can tap on a menu item, and it shows more details on that item, and then there's an "Order" button to order that item.
So I have 3 simple events: MenuItemDisplayed, MenuItemDetailsViewed, and MenuItemOrderered. Each event has a string attribute called MenuItemName.
I want to track performance and conversion on all menu items in one chart.
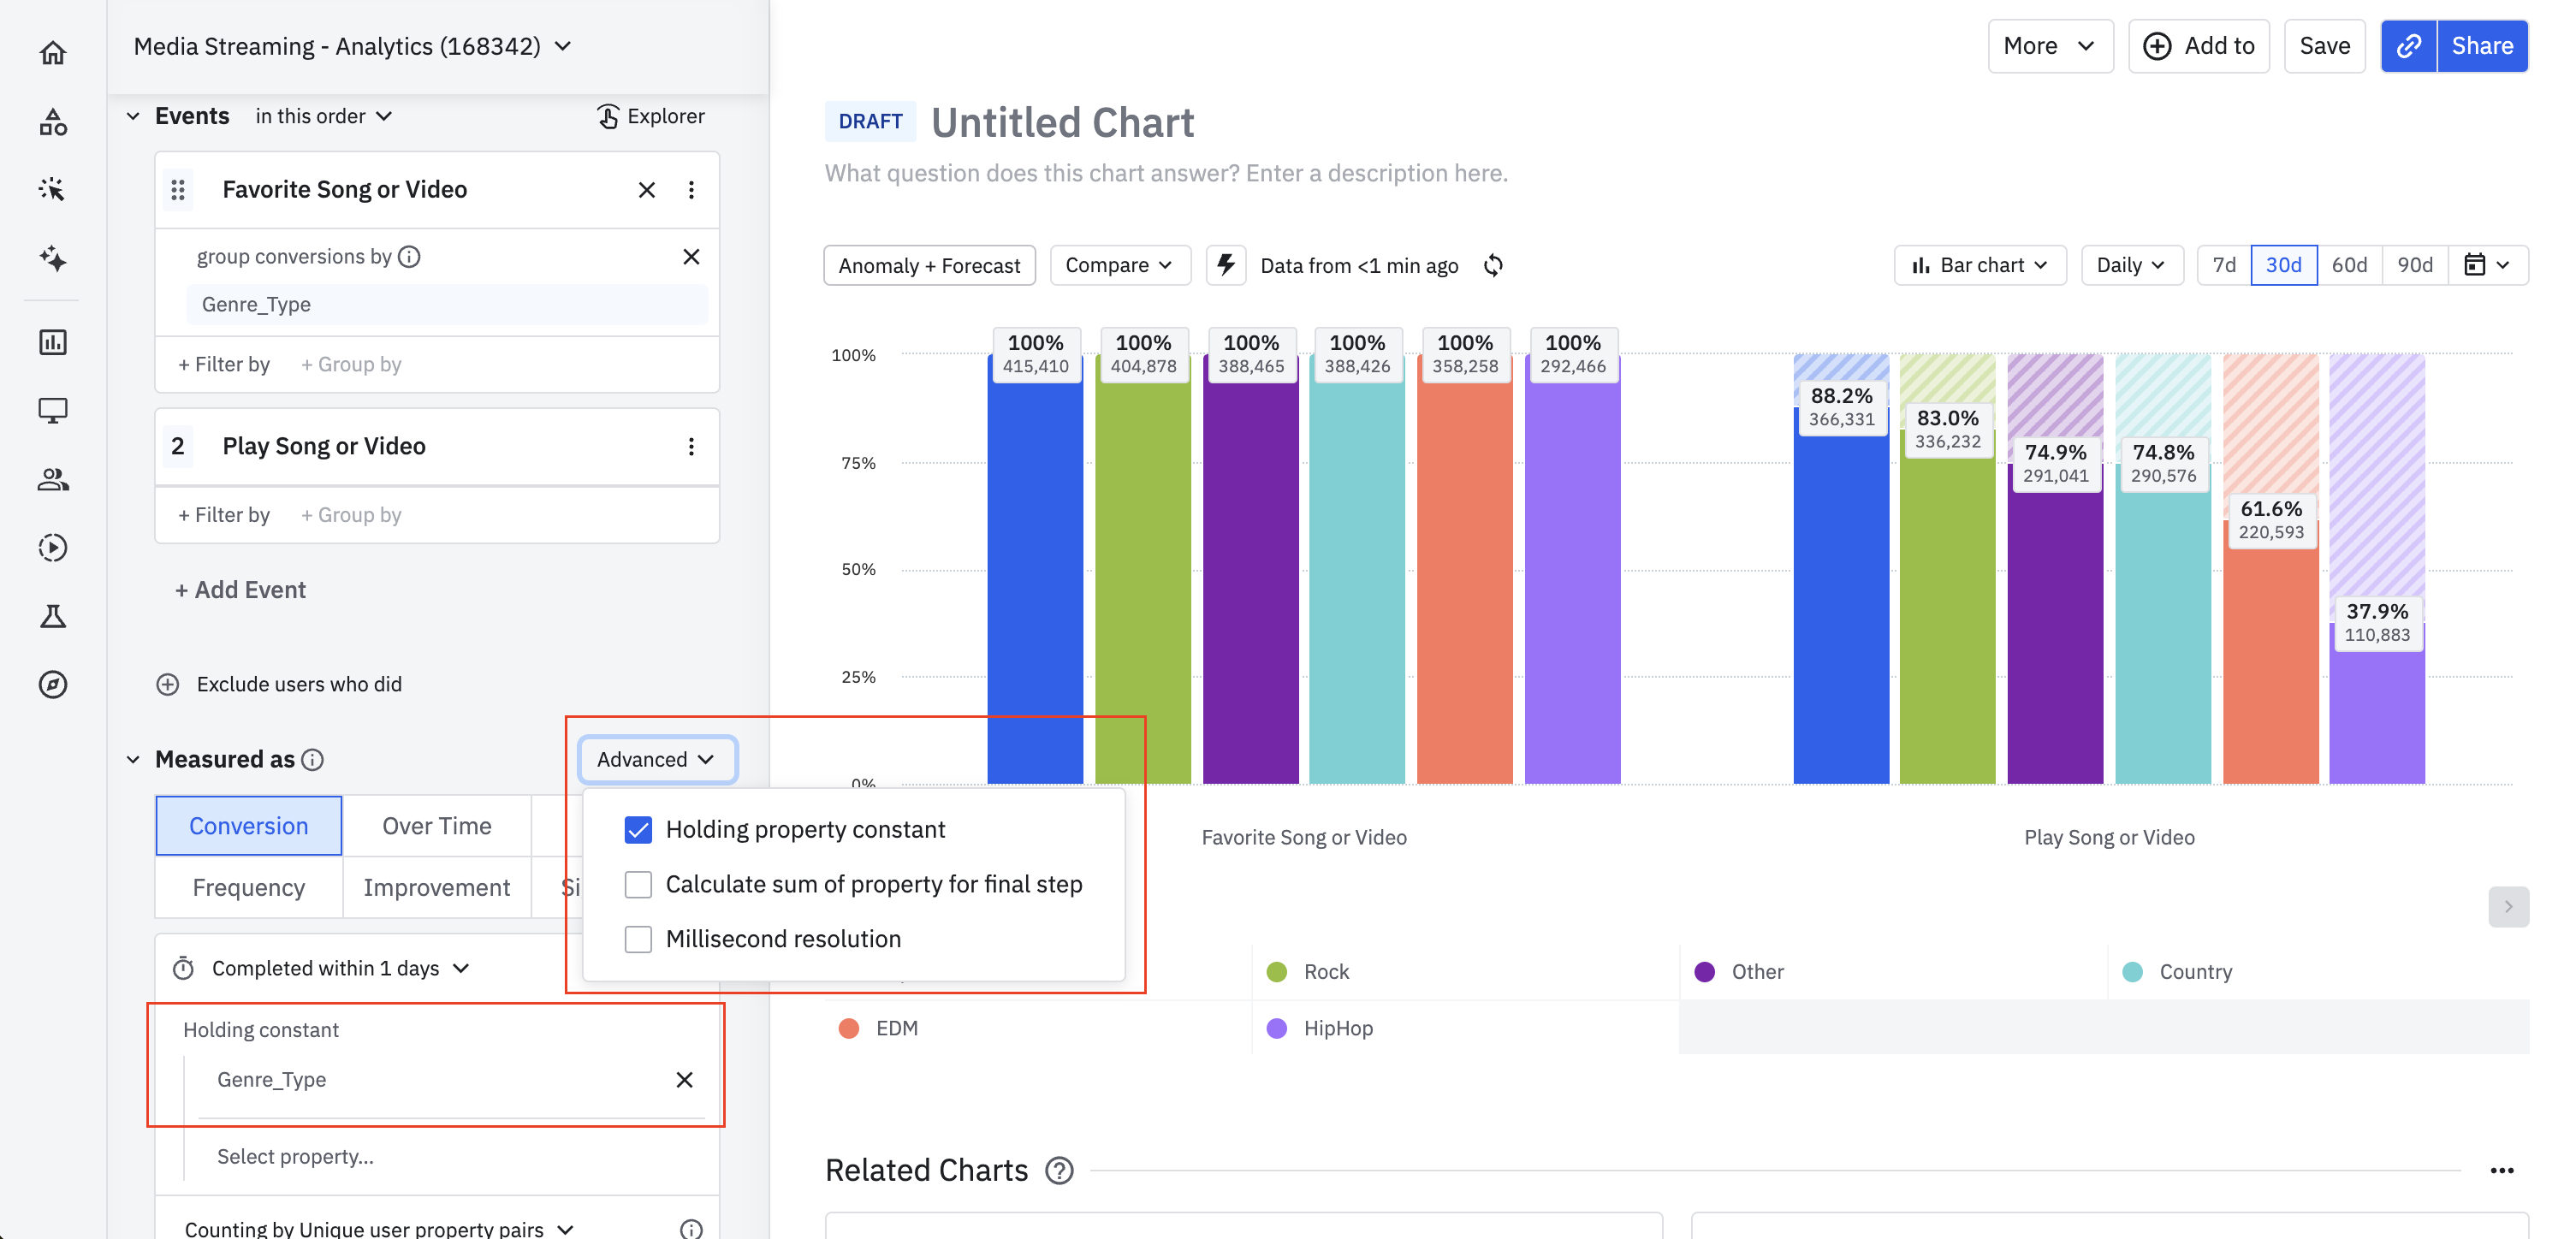
I can easily make one seperate chart for each menu item, but I have 30 menu items now so would need 30 charts. How can I make a "breakdown" based on MenuItemName to see which menu items perform the best or the worst all next to eachother?
I tried doing "group by" but it doesn't seem to work.