Hi, I am struggling to understand the following breakdown in the Monthly New Users view in the new retention chart. 


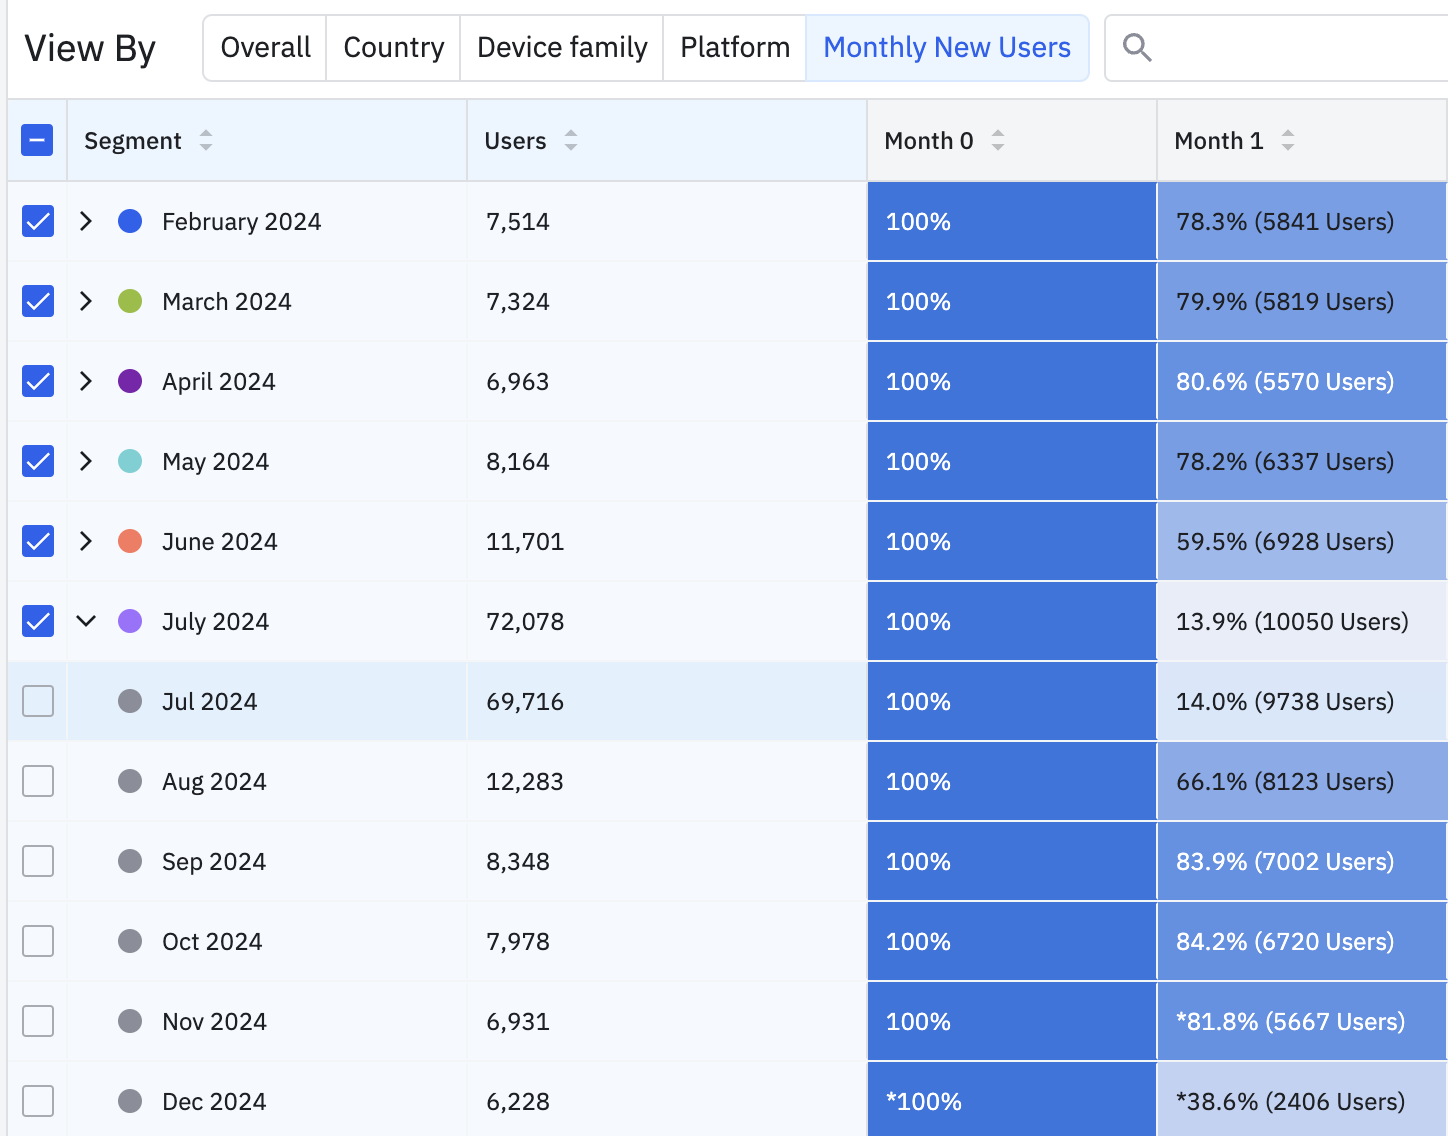
My understanding is that for July 2024, there are 72078 new users. But I am having trouble understanding what the breakdown of Jul 2024, Aug 2024, Sep 2024, etc mean? Does it mean that out of the 72078 new users from July 2024, 12283 of them came back in Aug 2024? I don’t think this is correct because on the July 2024 overall row, it shows in Month 1 there are 10050 users. And if this is the case Jul 2024 should match the overall row. Does anyone know what’s the correct interpretation?
 

Hi Gloria,

Thanks for reaching out. Based on the information you've provided it seems like you're using the 'Product Analytics - Retention' view. If this is the case, the columns will be broken down into the selected interval (monthly) and will dictate the retention percentage of those users.

For example, in February 2024, you had 7,514 new users who qualify for this bucket (meaning that they had performed their first event within this interval). This answers the question: 'Of those users, how many were retained MoM'. There were 100% of new users from February 2024 who had returned to perform an event within the initial month. 79.9% of the initial user subset then proceeded to perform a qualifying event in Month 1. So if your chart is viewing the last 6 months, then this will showcase the percentage of users who qualified for a given month and who performed a return even within that interval respectively.

You can read a bit more about Retention calculations here: https://amplitude.com/docs/faq/retention-analysis

Please let me know if you have any questions.

Best,
Jarren


P.S. Checkout upcoming events and user meetups on our events page.

@jarren.patao Thank you for the answer - yes this is the 'Product Analytics - Retention' view.

I am not sure if I follow the example - if I look at the February number, there are 7,517 new users, and in month 1, 78.3% of them came back (79.9% is the number for March). 

If I expand the segment breakdown for February 2024, what’s the correct interpretation for the Jul 2024 row with 6721 users showing 82.9% (5570) retention in Month 1?


And using the example I posted originally, if I expand the segment breakdown for July 2024, what’s the correct interpretation for the Jul 2024 row with 69716 users showing 14.0% (9738) retention in Month 1?


Maybe a more clear question is how to interpret this view? I noticed the numbers being plotted here are the column of Month 1 % in the Monthly New Users view (highlighted in the screenshot).


Hi Gloria,

The number you're seeing for July 2024 in the expanded segment breakdown for February 2024 represents the number of users who first performed the event in February 2024 and then returned to perform the event again in July 2024.

This is part of the 'Return On or After' retention calculation, where the numerator includes users in all data points prior to when they triggered an event. A user who triggers the event on day two, for example, will also be included in the data point for days one and zero. You can read more about this in the Amplitude documentation on Retention Analysis calculations.

The calculation for this would be the number of new users who triggered return event on X month or later after cohort entry date— divided by the number of users who triggered start event on cohort entry dates that reached the retention interval.

In the table, the All Users row contains the daily sums of the date rows below it. Incomplete data are excluded from the All Users totals (incomplete cells are noted with an asterisk).

After expanding the selection for a specific interval (i.e. Feb 2024), the user counts will only consider the users from that interval and then assess their activity for that given month meaning that all users in the expanded sections qualified as a new user in the February bucket. Whereas the overall segment (not-expanded) will calculate users based on the logic described above from the overarching timeframe selected (i.e. Last 6 Months) and not just Feb.

Best,
Jarren


P.S. Checkout upcoming events and user meetups on our events page.

Hi ​@jarren.patao, thanks for the further explanation. I understand how the Return On or After retention is calculated in the Chart - Retention view. But I don’t think that explains the Month 1 Retention Over Time chart in the 'Product Analytics - Retention' view. I also tried to find any specific help article on this view but I can’t find any. 


Following the interpretation of the traditional ‘Chart - Retention’ view, the definition you described above would be the “Month 5” 51.4% (3574 users) number, which is different from the 82.9% (5570 users) number. I am hoping to understand the difference between them, and be able to interpret the views under 'Product Analytics - Retention'. Is there any specific help doc for 'Product Analytics - Retention'?


Hi Gloria,

With Retention Over Time, Amplitude calculates this percentage by dividing the number of users from each new user cohort who triggered the return event on each retention day, by the number of users who were new on the selected day/week/month/etc. However, I'm checking in on the logic here internally to see if there is any updates/differences to the retention logic for this Web Analytics chart since you aren't able to select a starting or returning event. As soon as I can get some feedback here I'll get right back to you, but please let me know if you have any questions in the meantime.

Best,
Jarren


P.S. Checkout upcoming events and user meetups on our events page.

Reply