Hi there!
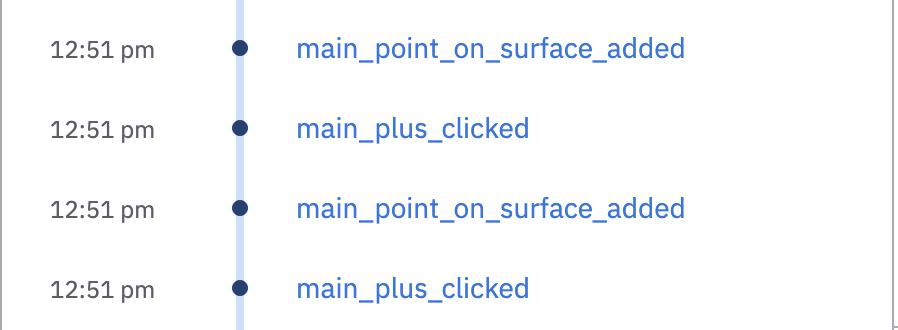
I’m trying to build a funnel with an event that triggers several times in a row to learn how additional clicks on that button impact the conversion. I’ll further need the same chart for 3 and 4 clicks in a row triggering the main_plus_clicked without any events in between.
I’ve probably tried a dozen of options to build this funnel but none of them bring correct data. The last one I tried is the chart with exact order I read about in this topic.

It didn’t work out as well triggering when there’s the main_point_on_surface_added in between two main_plus_clicked events. I’ve also tried to exclude different events but the result was the same.

I suppose the problem is that the final event main_point_on_surface_added should normally trigger after each click on the main_plus_clicked but under certain conditions it doesn’t (and these are the cases I need to track down).
Is there any way you know to solve that issue? We’re currently using the basic plan.