Hi,
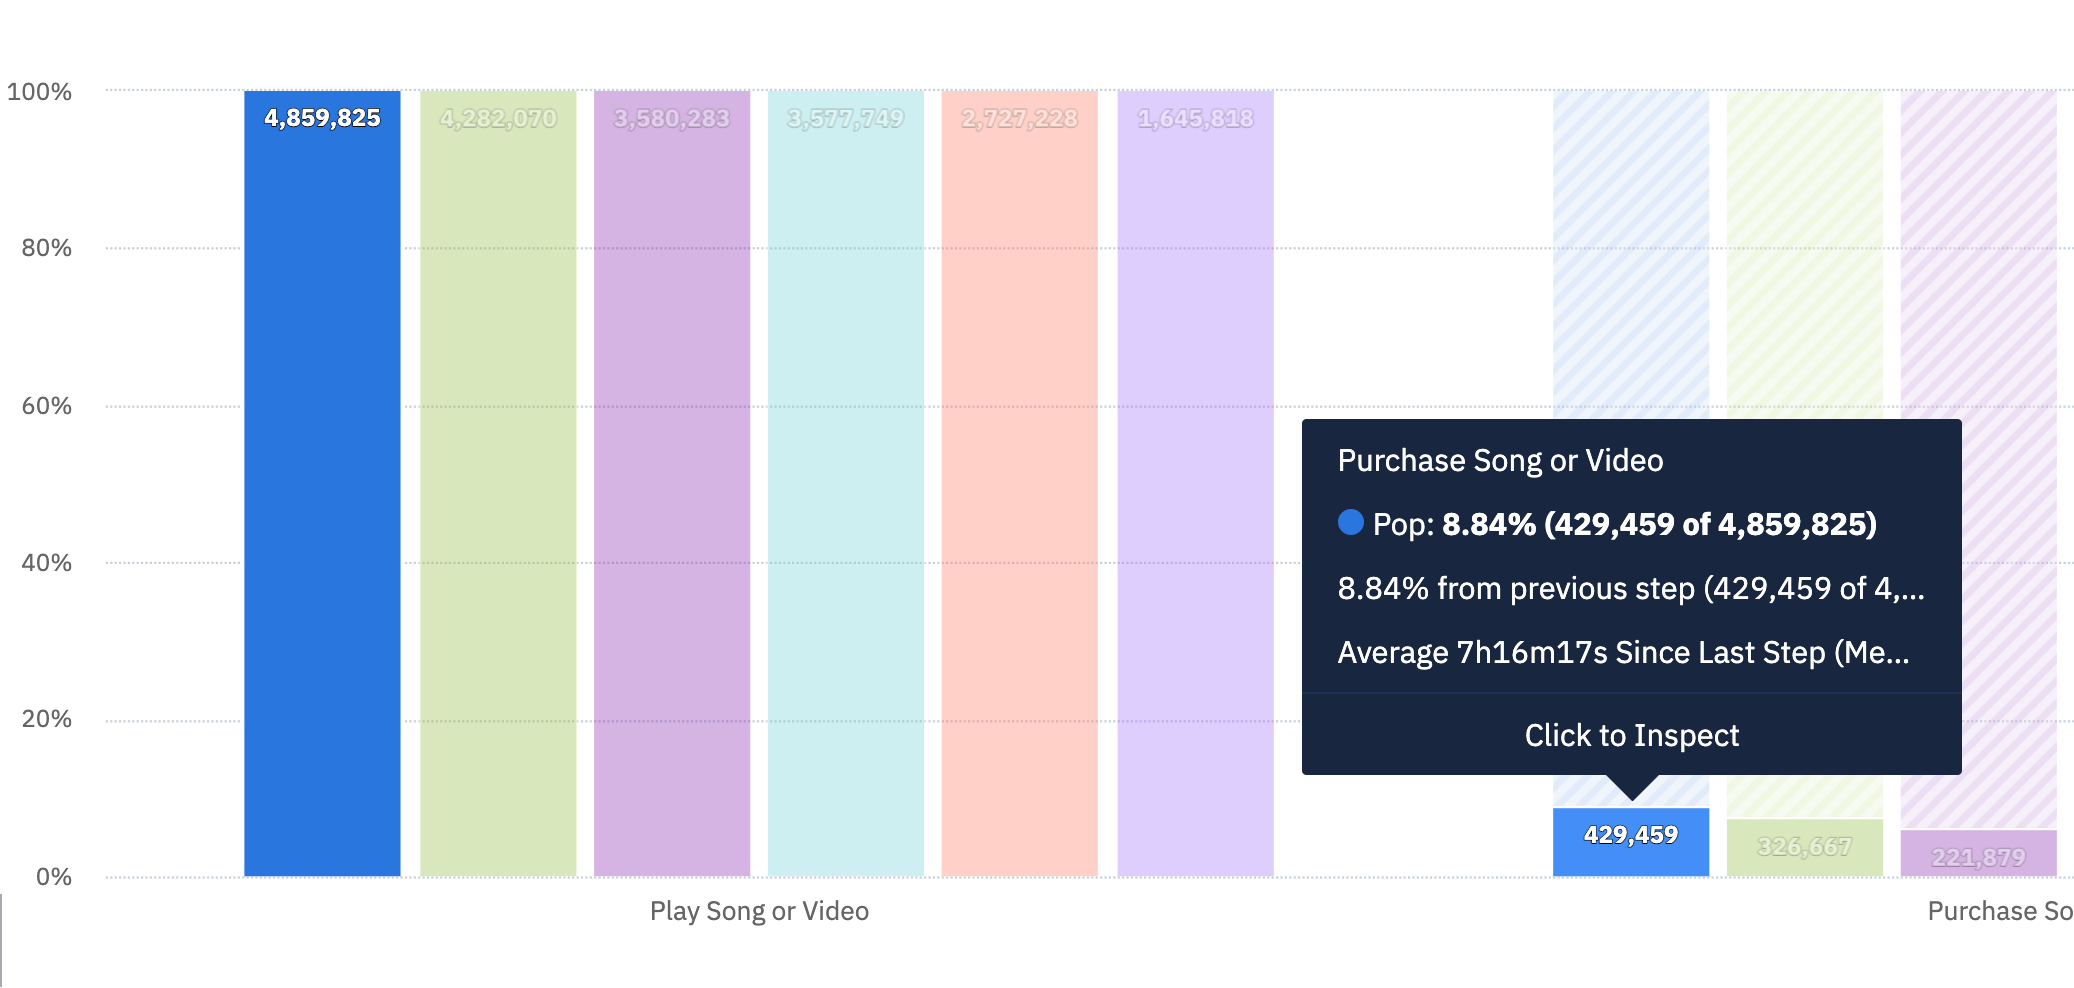
I have multiple CTA on the page and I want to know each one’s conversion rate.
To compare CTA fairly, I use the element visibility as each conversion’s denominator so all CTA have different denominators.
I create multiple funnels for each CTA now, which is inconvenient to see the overall performance.
Is that possible to compare different conversion rate in one chart? (like each bar has its own custom calculation so I can compare all CTA in one chart)
Thanks!


