Solved

Historical total number of unique users changing over time (especially in most recent week)

  • 13 July 2022
  • 2 replies
  • 202 views

Userlevel 2
Badge +1
  • Helpful Hero
  • 9 replies

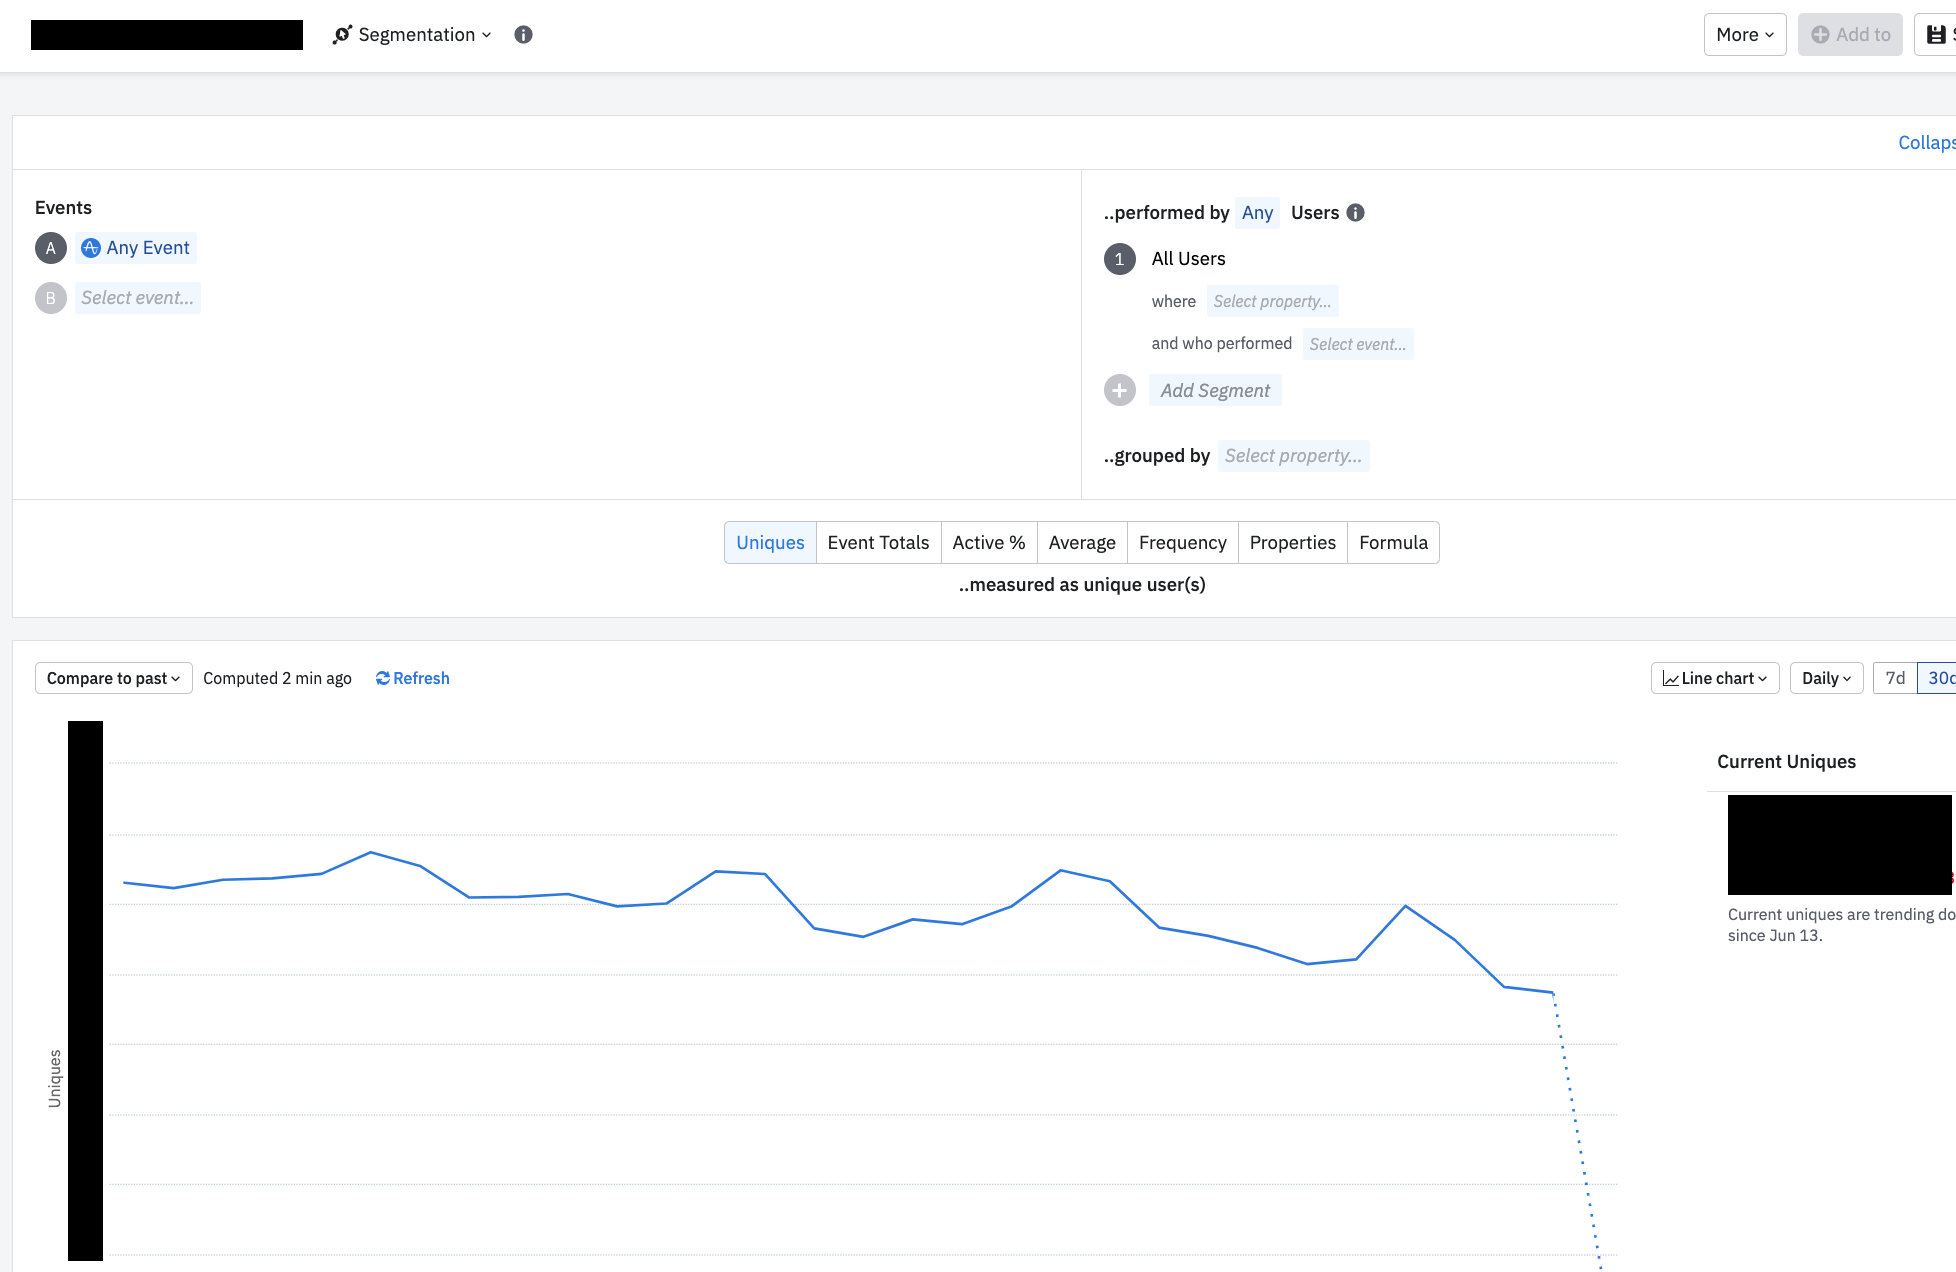
I used the dashboard API to extract active unique users data, on segmentation view (image below). But for this, every time I try to extract the last 30 days data, I saw changes in most recent week (mostly the number increased). So for example, here is the extraction on:

  • 1st extraction on 10th June: Active Unique users on 9th June is 500
  • 2nd extraction on 11th June: Active Unique users on 9th June is 511
  • 3rd extraction on 12th June: Active Unique users on 9th June is 517

**Additional data: I use User ID, and one User ID can have multiple devices

Therefore I want to ask, is this an expected behavour? And if it, why this is happen ya?

Thanks! 


icon

Best answer by Amplitude Admin 14 July 2022, 10:40

View original

2 replies

Userlevel 6
Badge +9

Hi @Lau - Thank you for writing this post! This behavior is not uncommon because in some cases events could be logged later than the event firing time. 


Losing internet connection can certainly be one of the circumstances. Another common reason is how our SDK works. Our SDK’s have built-in batching that only uploads events after 30 seconds or 30 events. When users fire events offline or the app was closed too soon (within 30 seconds), the events could not be uploaded at the time of firing and were stored in the device. Once the device is online again or the app is reopened, events fired before would be then uploaded to Amplitude, and Amplitude will sort and process the data based on the time the events were fired.


Hi Amplitude team.
Ran into something similar.

Computed data for 1st of Jan - 21st of Feb somewhere in April and the returned info was that the CVR for the final step (completed the 4th room) was 15.1%.
When i computed it this morning, CVR is returned as 4.77%

Can you please assess and advice?


Reply