Hi @xiaomeng.zhang,
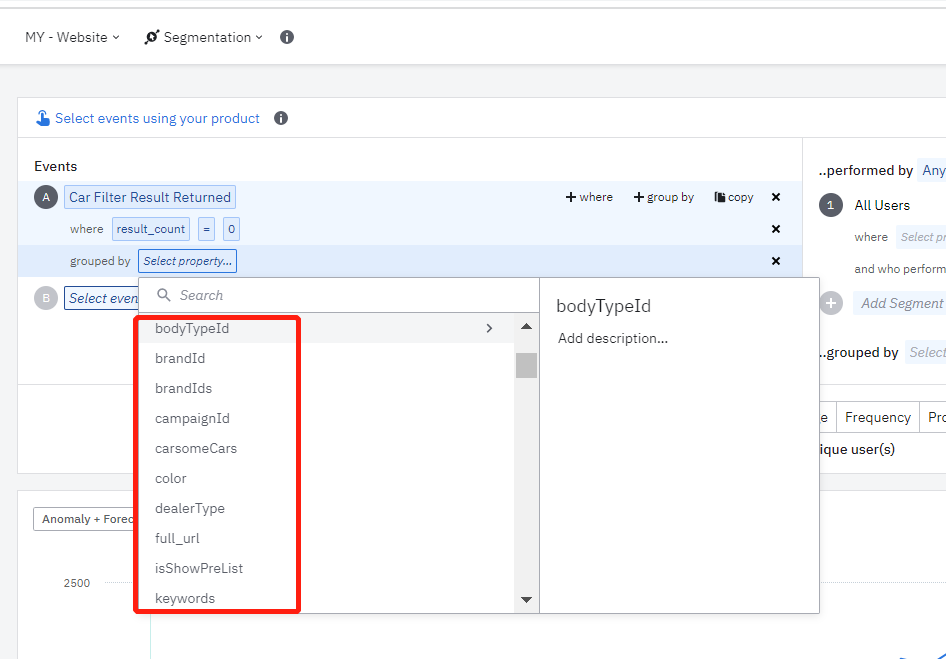
So you want to see all the possible values given for each of the properties. Unfortunately, there is no native way to do this in Amplitude but something you could do is group by that property and see all the possible values given over a time period. For example, in this example from the Amplitude demo, I grouped all events by the genre_type for the last 30 days to see all the different values for the genre_type property. Chart here.
Another option is to use a User Composition chart to see all the values for a user property. Not an event property, unfortunately!
I hope this helps regardless! I am happy to submit this as a feature feedback request if you can PM me the email you use for Amplitude!
Kind Regards,
Denis