Dear Amplitude Community,
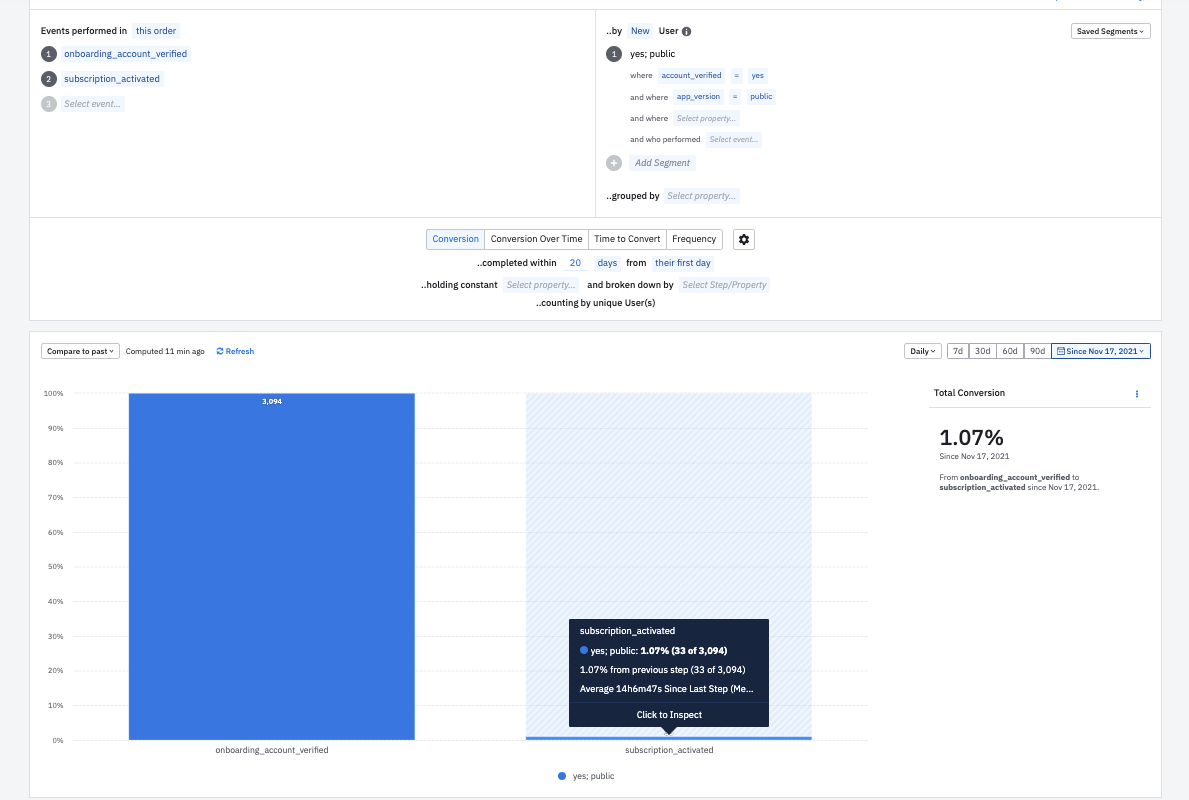
I would like to know how many of our new users (Step 1: verified account) convert into users who activated a trial / subscription (Step 2: subscription activated). Hence, I created a Funnel chart with those two steps and applied 20 days as a conversion window.
The total number of converted users since November 17th that the chart shows me is 33.
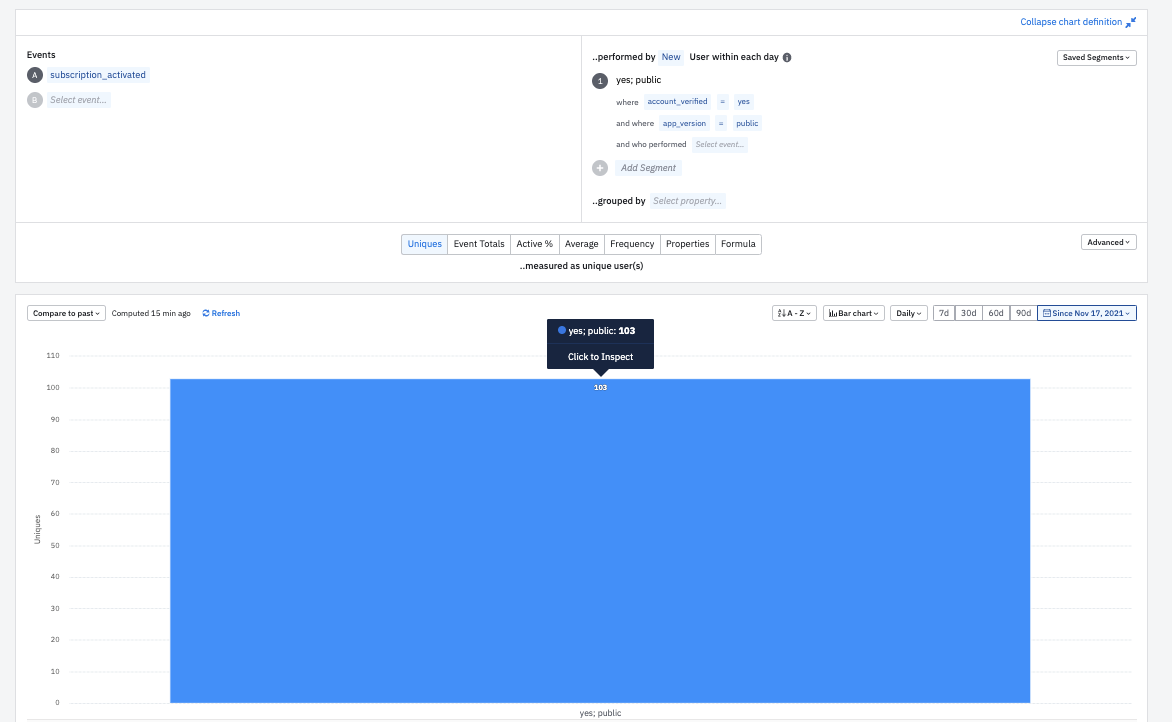
But, when performing a similar analysis in an event segmentation chart (event: subscription activated) performed by New Users WHERE account verified = yes and looking at total unique users since November 17, it is 103 users. How can that be? Do I misinterpret the New User Property?
Thanks a lot in advance!
Please see screenshots below:
1) Funnel Chart

- Event Segmentation Chart:


