Hi,
I found the discrepancy between funnel analysis and show user paths.
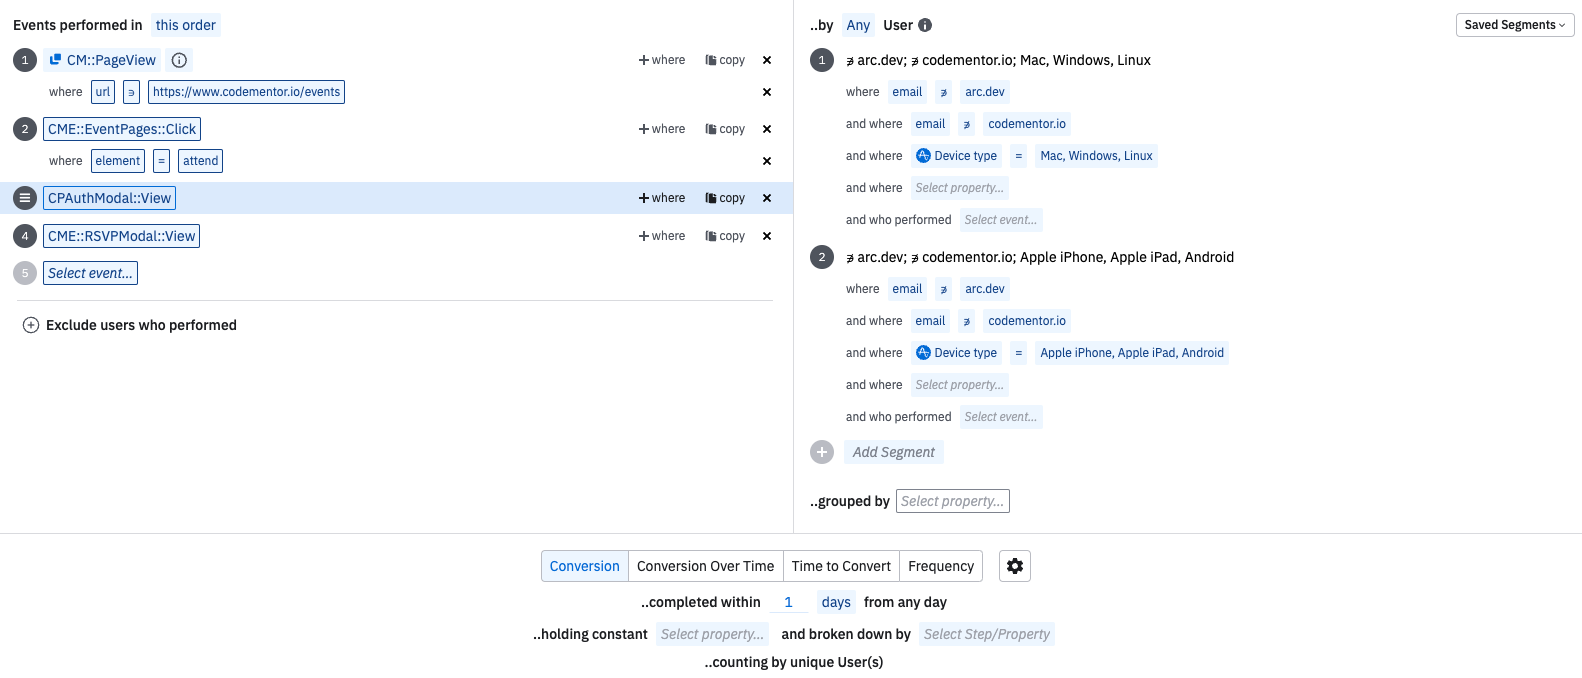
This is my setting:
exclude Auth Modal

And the result is as follow:
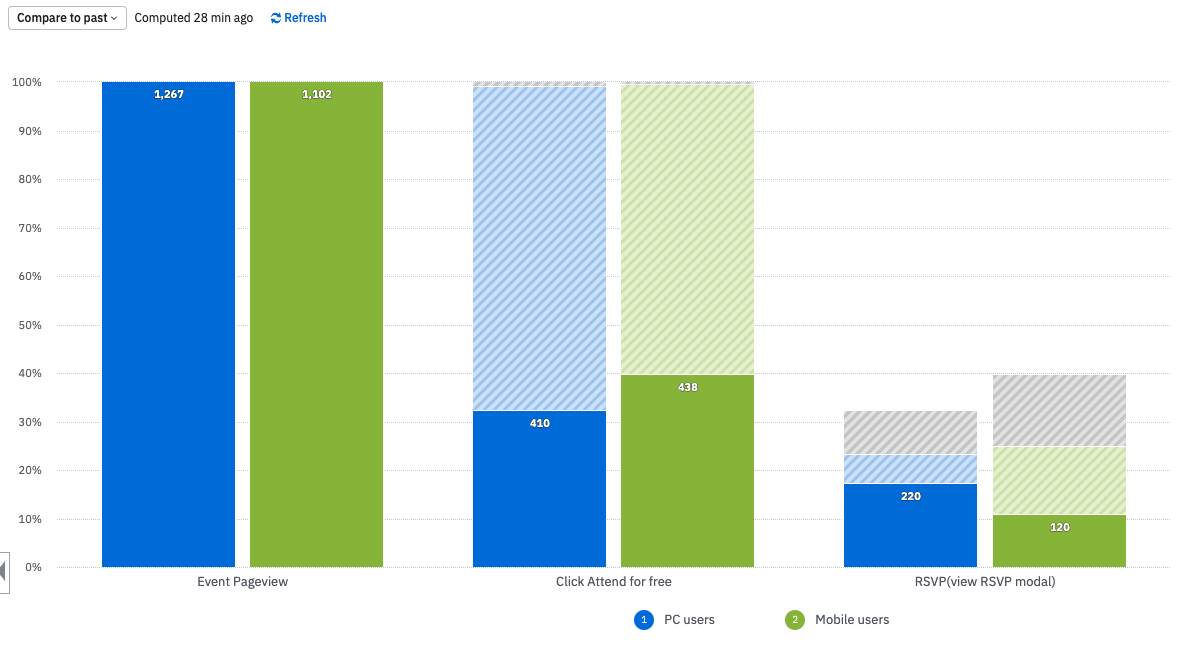
Regarding the third bar, I expected:
- Gray area is the No. of users who performed Auth Modal so it is excluded
- Heavy green area is the No. of users who didn’t performed Auth modal and perform the action I need
What I don’t know is what the light green area mean?
In my assumption, the area from light green and heavy green means users who didn’t performed Auth modal.
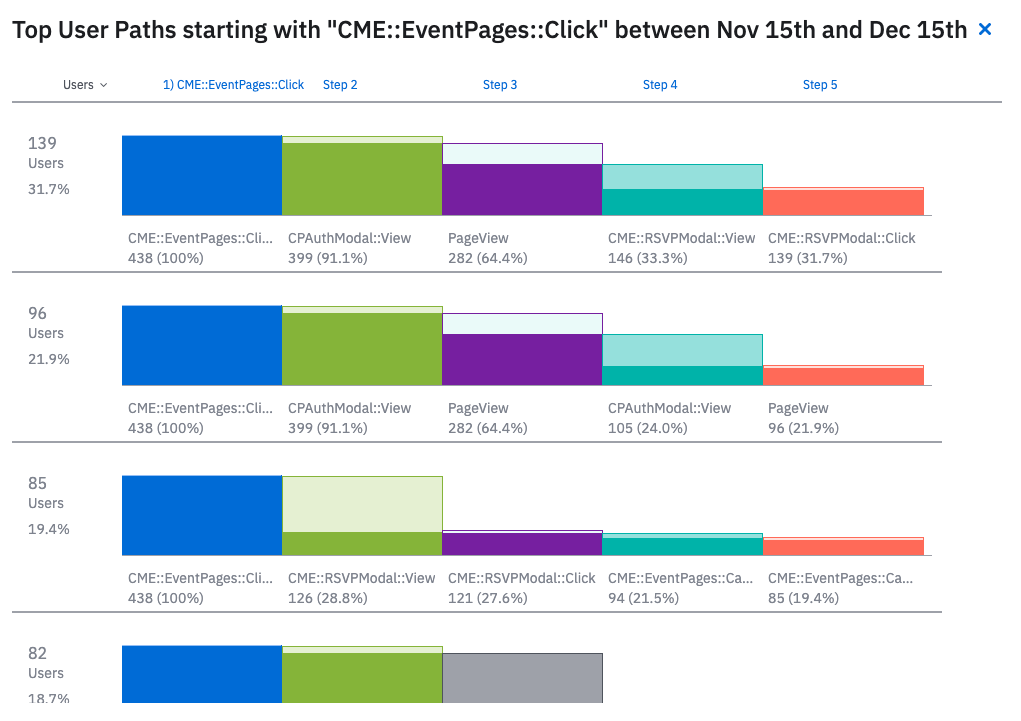
But after looking into “show user paths”, it shows only 28.8% of users who didn’t perform Auth modal and the number is near the heavy green area.
Where did the light green area come from?