Clicking on (opening) charts from filtered dashboards no longer preserves the filter from the dashboard. Is this a new permanent feature or a temporary bug?
My process for reviewing new version rollouts for our Android app looks something like this:
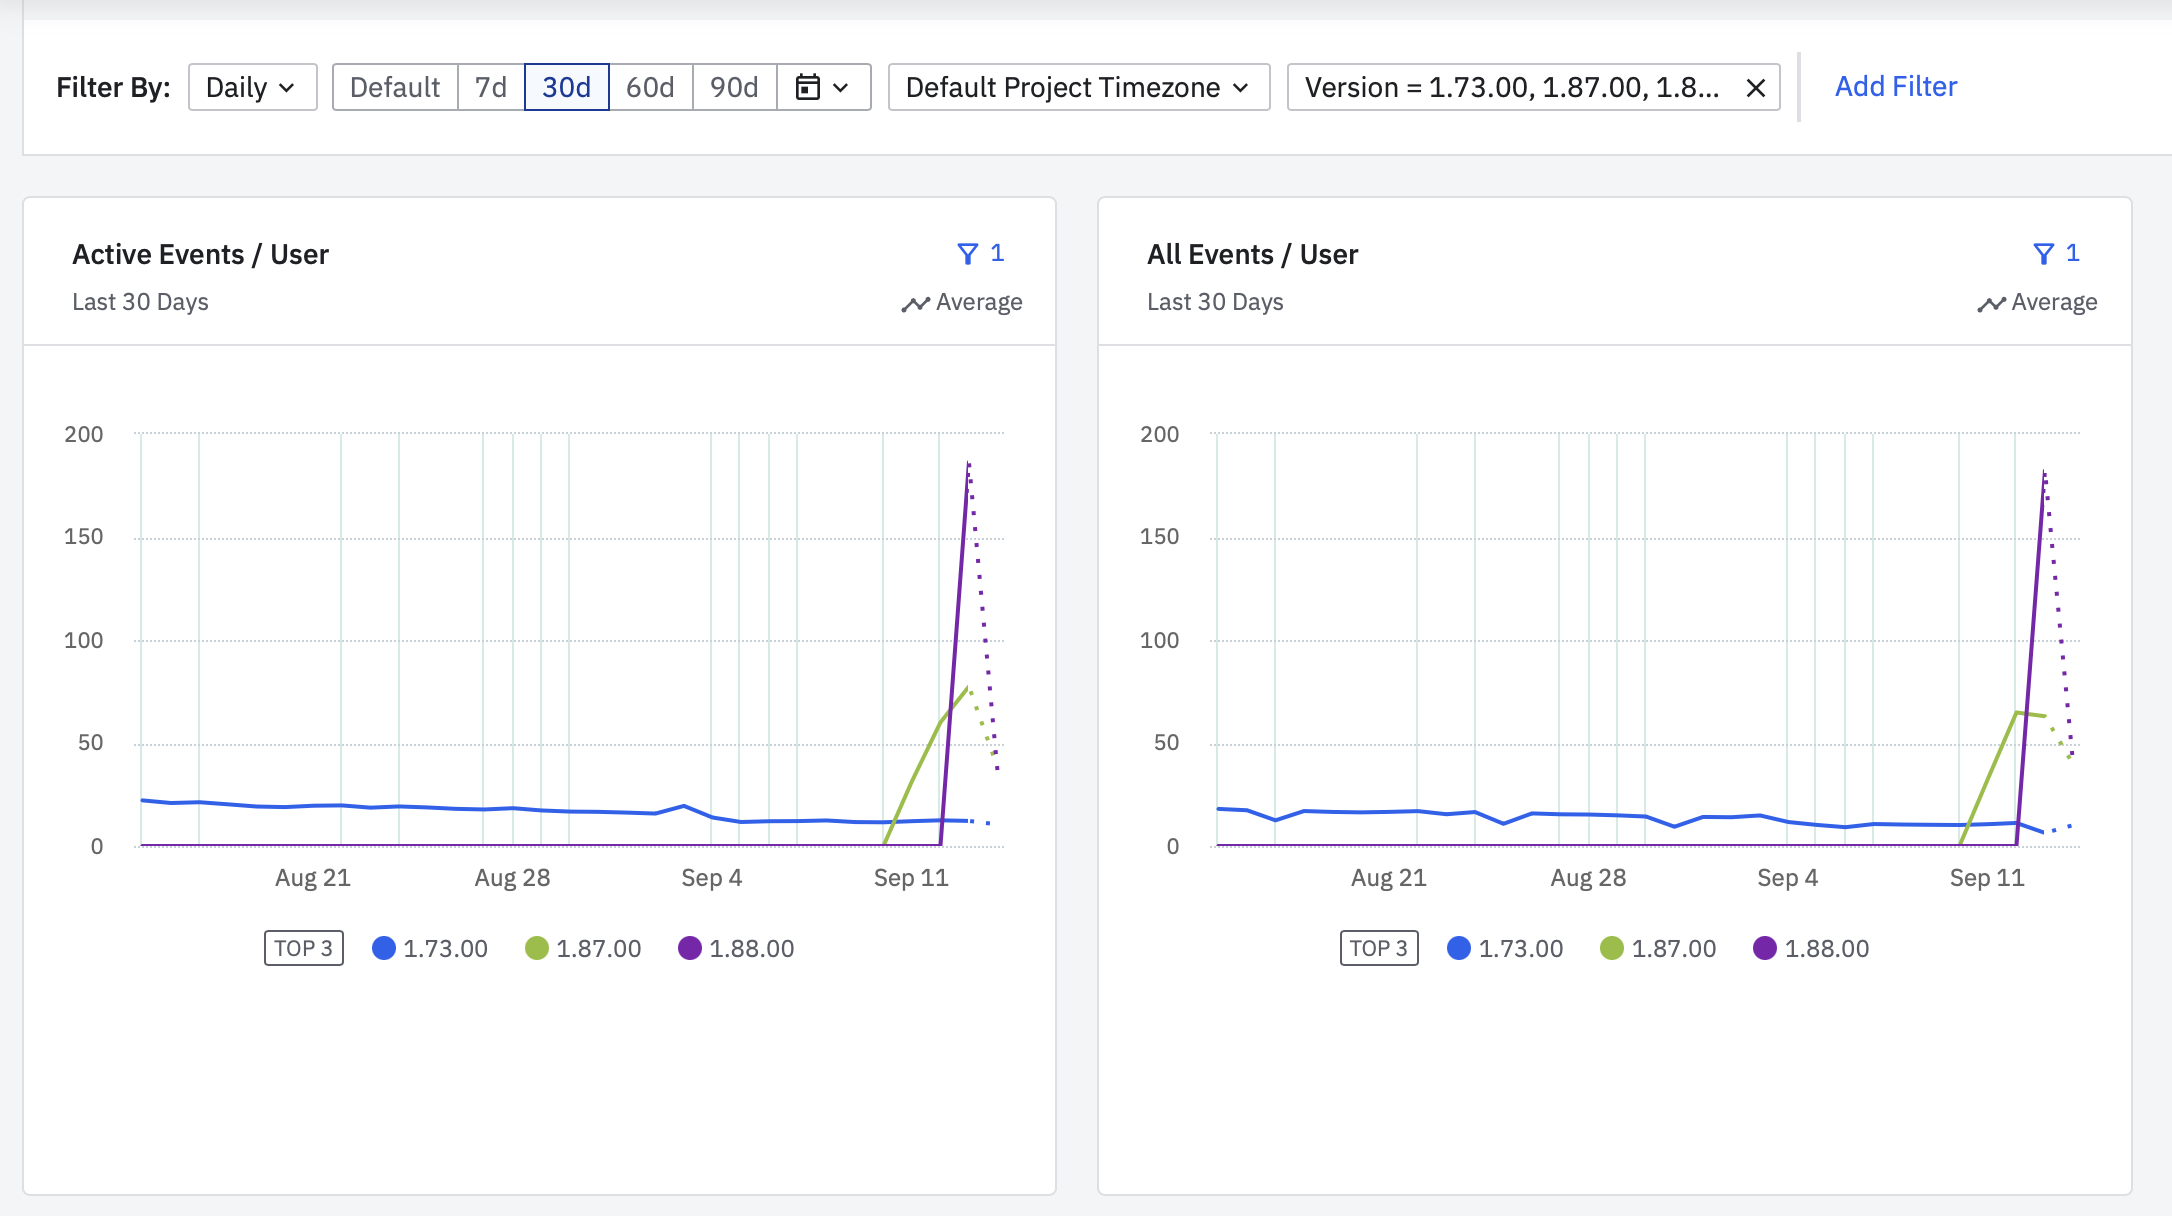
- Create a dashboard with dozens of charts grouped by version, that monitors the health of all the app’s features.
- Create a dashboard parameter filter that tracks a stable build and a few of the newest beta versions, for example, only showing versions 1.78, 1.87, and 1.88.
- Check the dashboard on a daily basis to see how the newest beta builds are performing.
- Open all charts that indicate the newest builds are underperforming to dig deeper into why they are behaving anomalously.
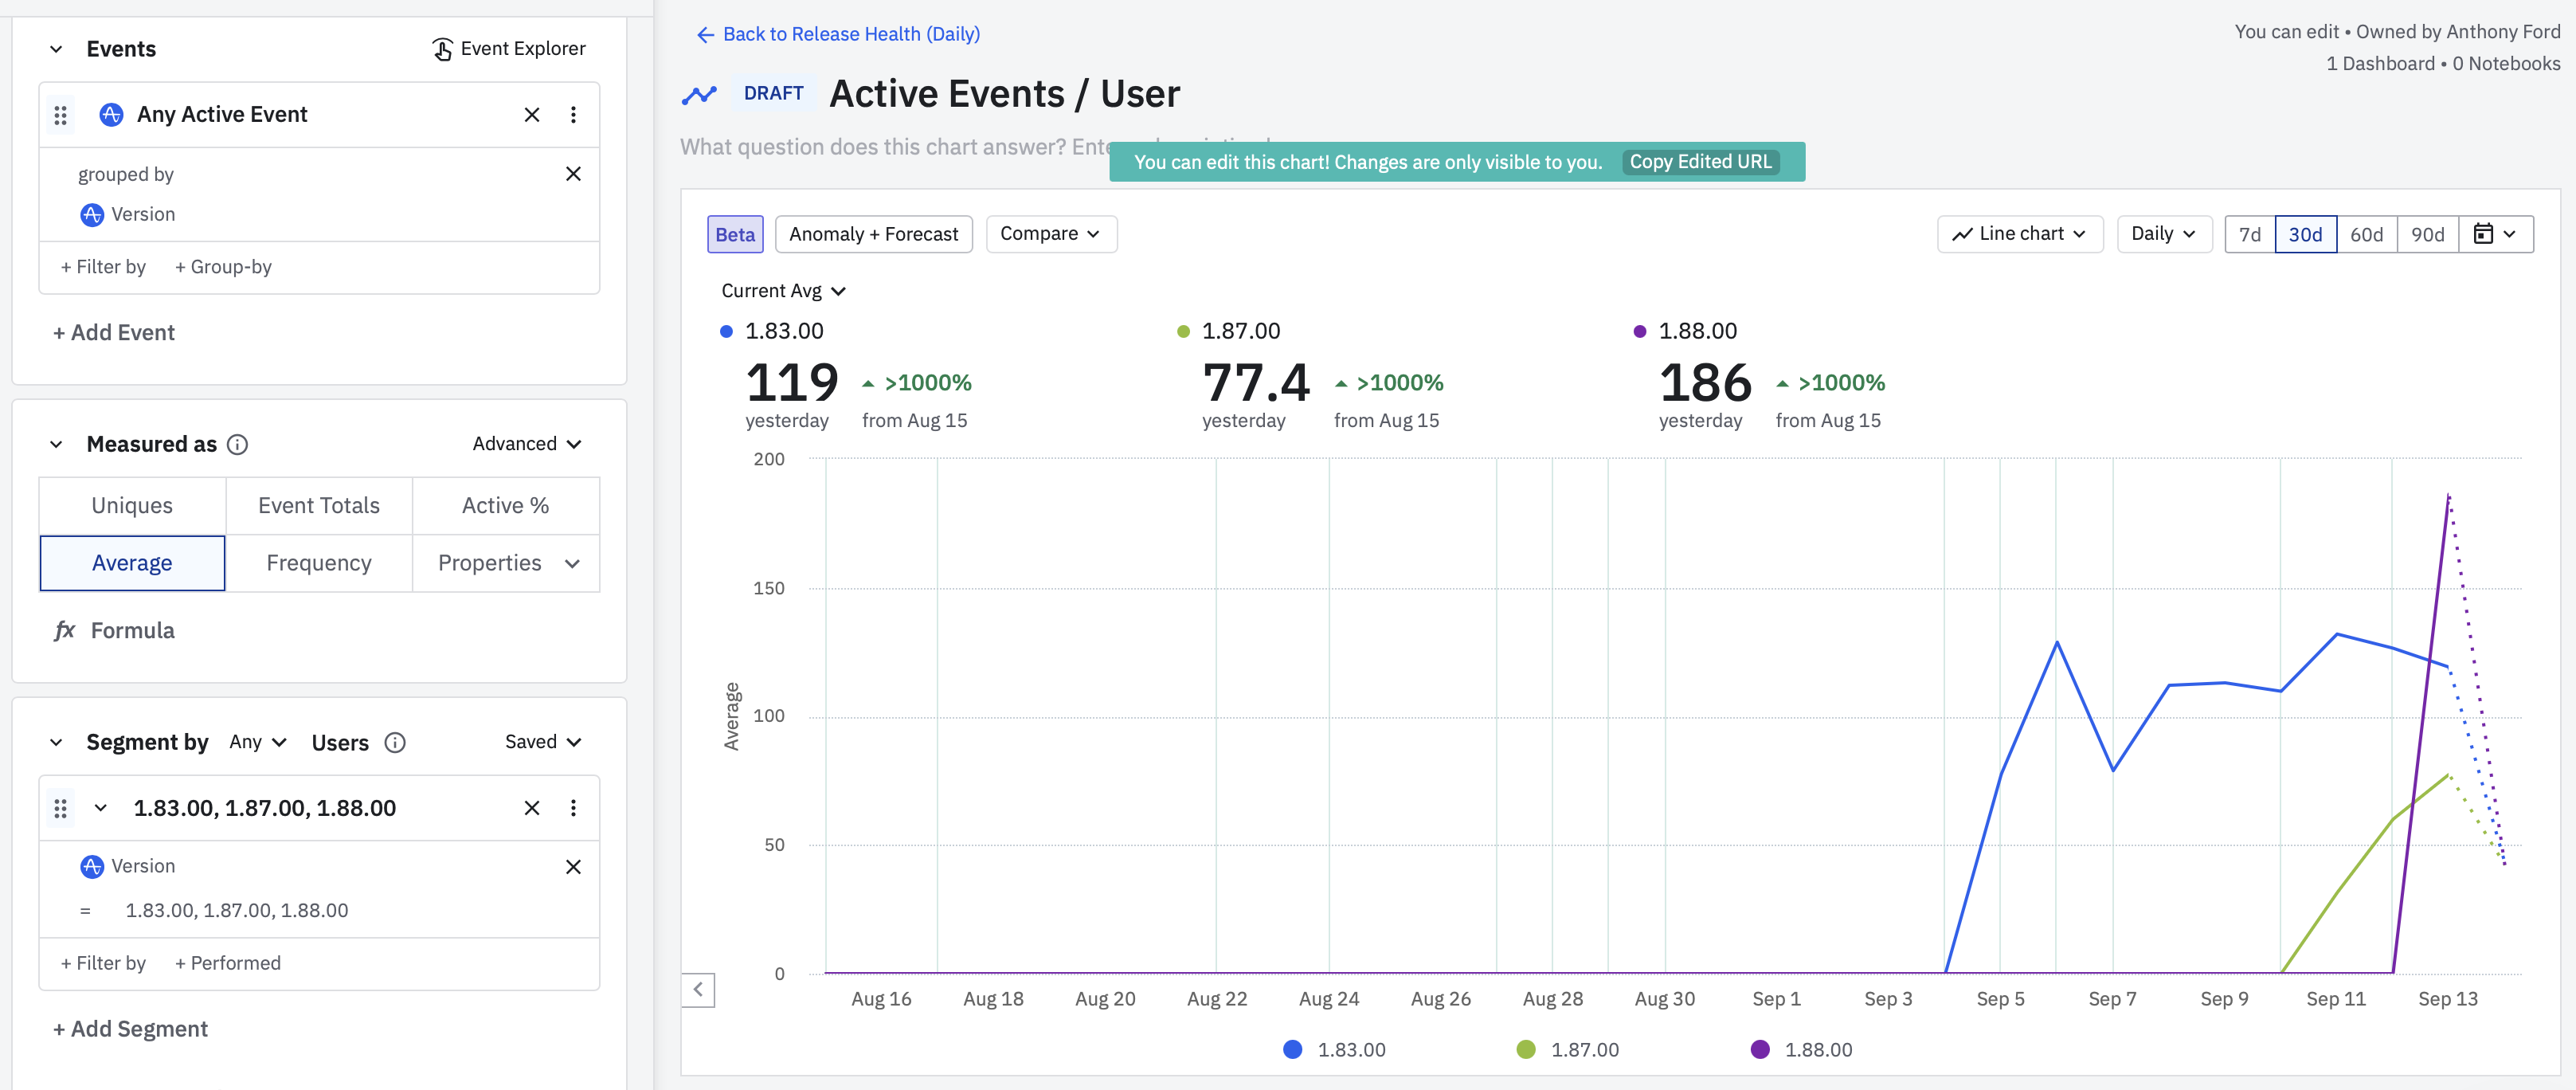
- Until today: The charts would display the three versions from the dashboard filter.
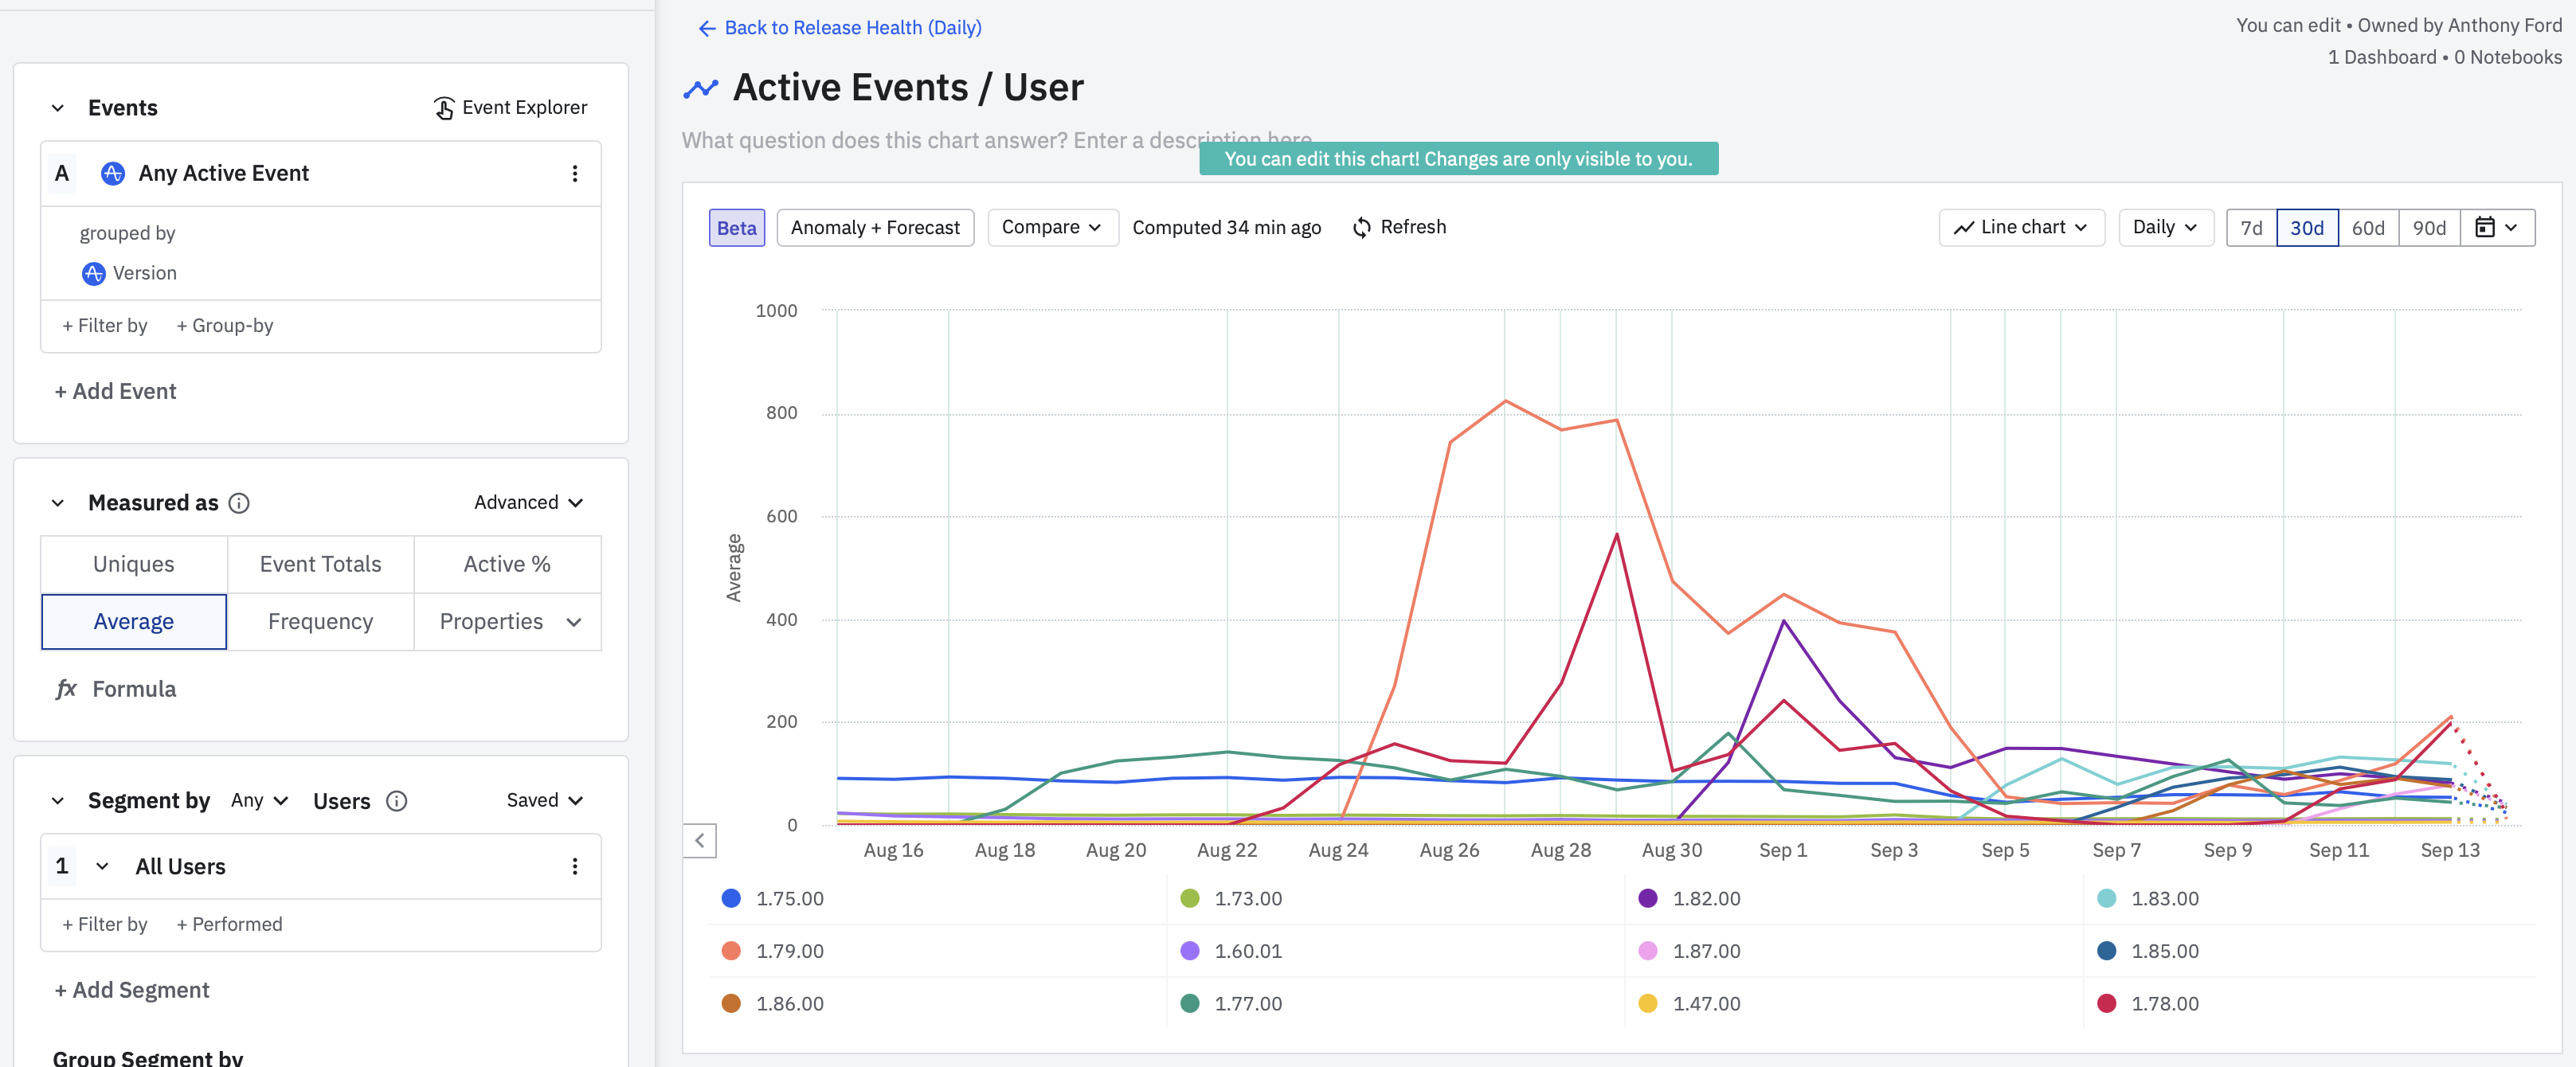
- Starting today: The charts show 20+ versions, so I need to re-add the filter for every chart.
Maybe there’s a better way to be doing this app release review(?), but for now, the new feature/bug is slowing me down a bit.
Thanks!
Dashboard Set Up
Click on chart today
Clicked on chart yesterday