Solved

Calculate Free to Paid conversion based on event property


Userlevel 1
Badge +1

Hi,

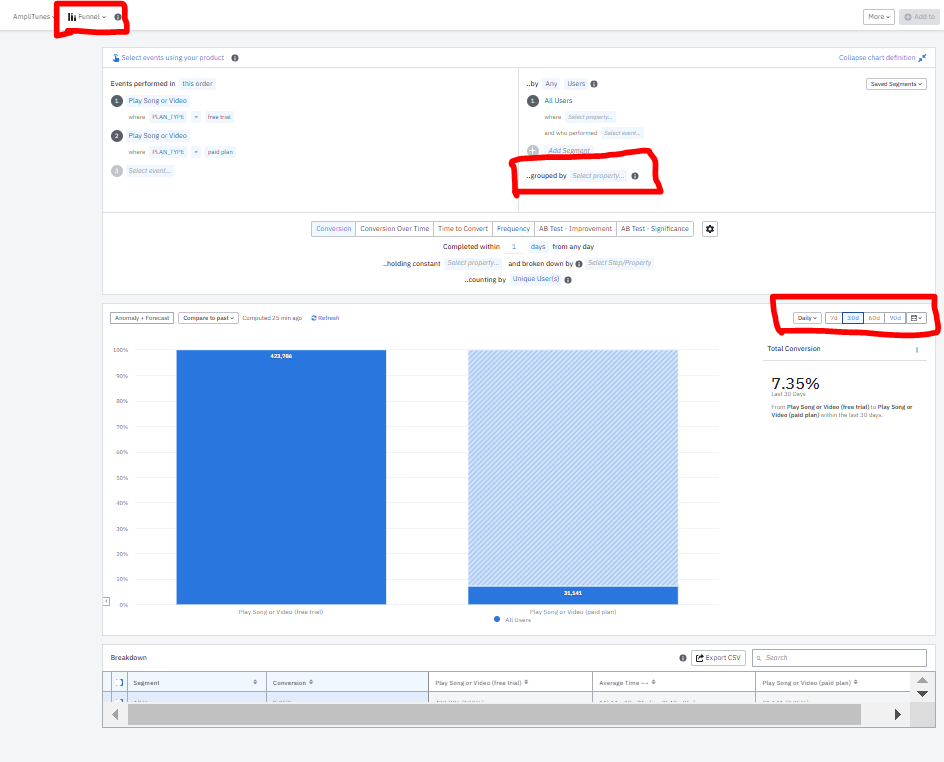
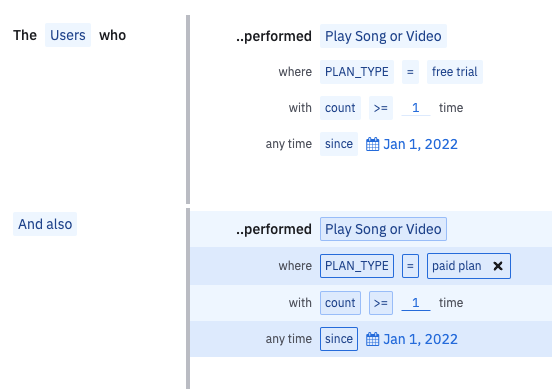
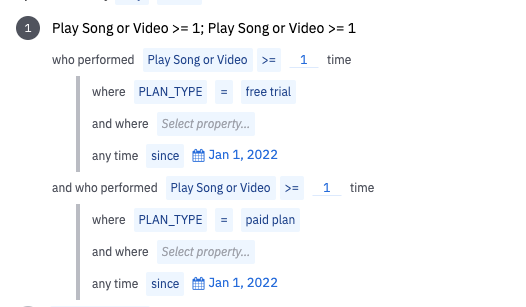
Is it possible to create a graph, showing users who performed BOTH of these events with conditions:

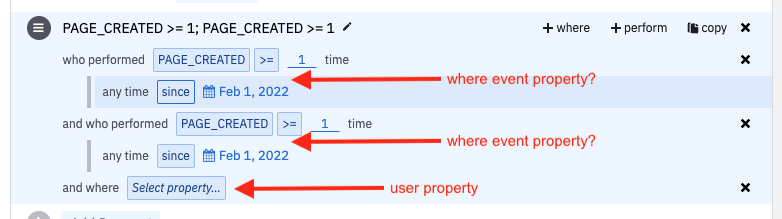
PAGE_CREATED (where event property APP_TYPE = FREE_VERSION)

AND

PAGE_CREATED (where event property APP_TYPE = PAID_VERSION)

We currently only know if a user upgraded, if he performed the same event with a different property. 

Any help is appreciated!

Thanks

icon

Best answer by Tatiana 8 July 2022, 19:40

View original

6 replies

Userlevel 7
Badge +10

Hey @lukeamp 

You can either create a Behavioral cohort matching those conditions or use a inline segment to define these clauses in an event segmentation chart

  • Cohort
    Segment


Let me know if I have interpreted your use case correctly. Hope this helps.

Userlevel 1
Badge +1

Hi Saish, that seems what we need, but unfortunately we don’t have the Cohort feature. any chance to do this in a normal Chart?

Userlevel 7
Badge +10

Hey @lukeamp 

The 2nd option is using a segment in a normal event segmentation chart. Something like this chart.

Let me know if you are able to replicate  this in your use case.

Userlevel 1
Badge +1

Hey @Saish Redkar

This would be exactly what I need but I can’t figure out how to add a “where” to the event property?

I only have “where” for user property


Any suggestions?

Userlevel 2
Badge +1

Hi @lukeamp , unfortunately, the in-line cohort add-on (the option to add a where clause to the and who performed segment definition) is available only to customers on enterprise, scholarship and growth plan. (see here)


I would recommend you to build a regular conversion funnel as:

first event → Page_Created ‘where’ APP_TYPE = free_version
second event → Page_Created ‘where’ APP_TYPE = paid_version

there you will see the conversion rate for users who used in first place the free and the the paid version. In case you need daily (or other frecuency) performance, then you could play with the date filter on the right upper corner of the chart. Or also using the group by clause could support your analysis to find more details on your users.

hope it helps,


Userlevel 7
Badge +10

Thanks for pointing that out, @Tatiana.

Reply