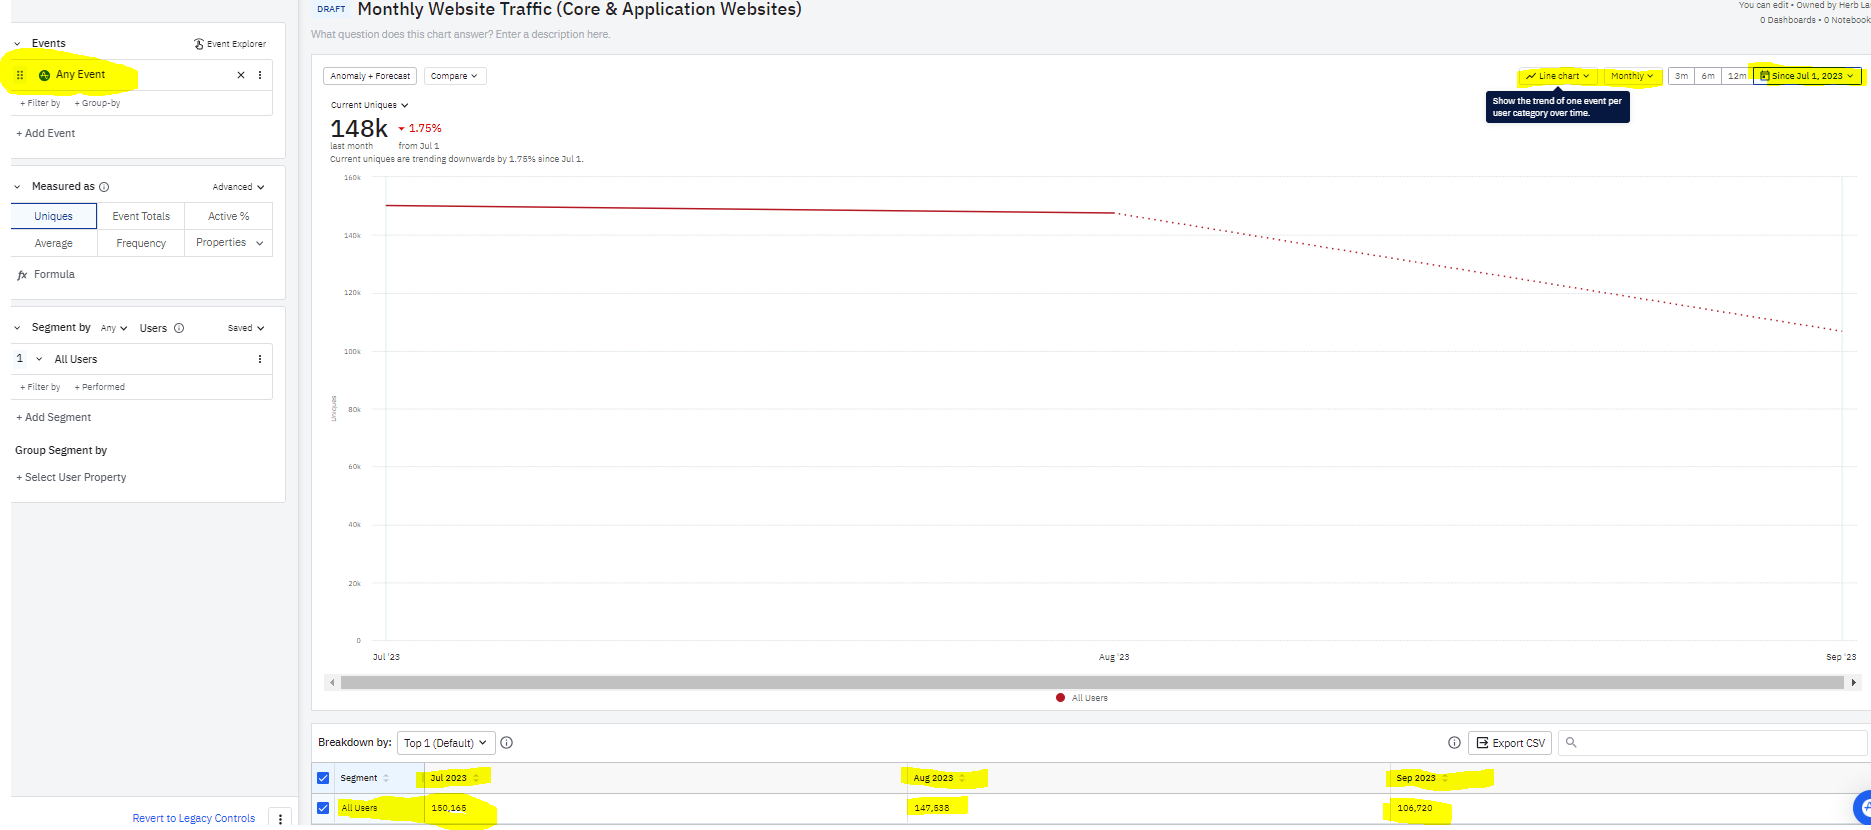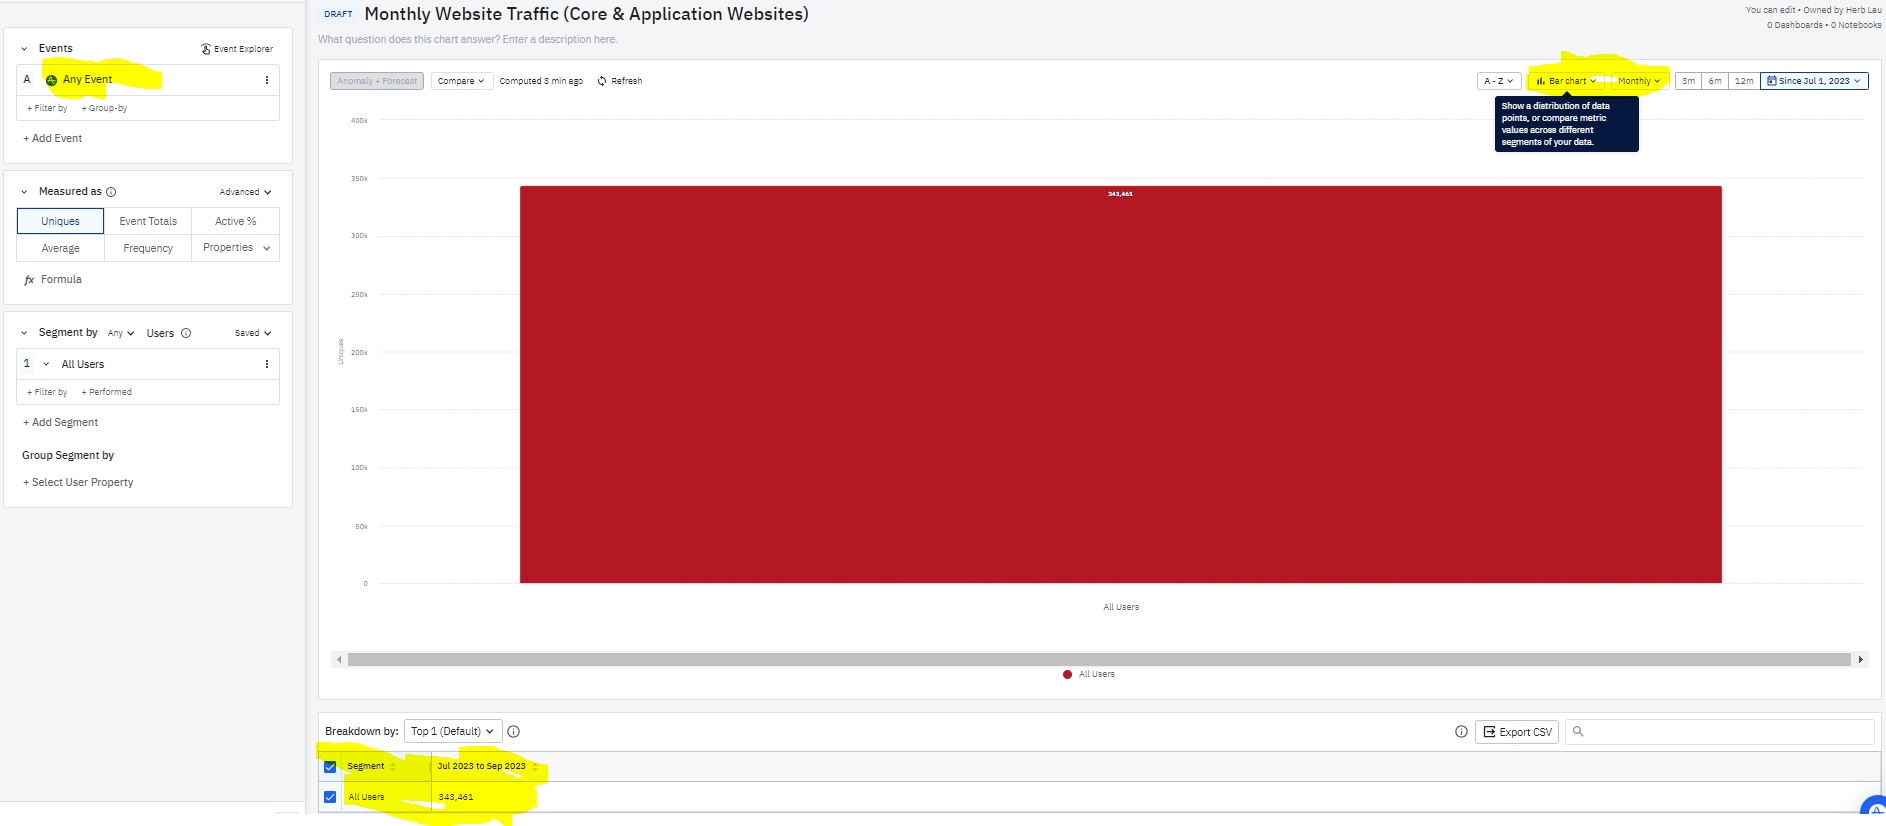

Is there a reason the bar chart doesn’t divide out into months’ data?
The line chart above doesn’t seem appealing visually to my end users.
The bar chart, for whatever reason, doesn’t seem to want to divide into groups based on the month.
The time controls at top right are for Since July 1, so for the current day, I’d hope for July, August, September, with September having less since it’s a partial month. There also don’t seem to be Amplitude event properties based on the time stamp of the event visible within the event options, so I can’t run some kind of calculated field on the month of the time stamp.
The 2 time options available for Group By seem to be Hour of Day and Day of Week, which are nice to know, but not as helpful to the end user.