It is probably a conceptual problem, but I don´t understand why this 2 scenarios give 2 different results:
Event A where propertie A = 1 and propertie B = 1 | no user restriction
Event A with no restrictions | users where propertie A = 1 and propertie B = 1
Thanks!
Page 1 / 1
Thanks for reaching out here @trosen. This is a great question. This glossary - link - is helpful as you continue to get to know the tool. Let me know if you need some additional clarification and I can get more members of the team to take a look.
Hi @trosen, thanks for reaching out with this!
Since you are filtering by the property values in both the Event module and the User module, I assume these are user properties that you’re working with.
Can you provide screenshots of these queries based on how you set them up? That will help me understand if a difference in the results is to be expected or not.
This may also be happening because one chart’s results were refreshed sooner than another. When comparing the results of these scenarios, please make sure the results are refreshed. You can see this option at the top of the chart visualization (see the screenshot attached).
Thanks!
Hi @Jeremie Gluckman@tsegalla,
I did a refresh in both so that’s not the problem. Here are the screenshots:
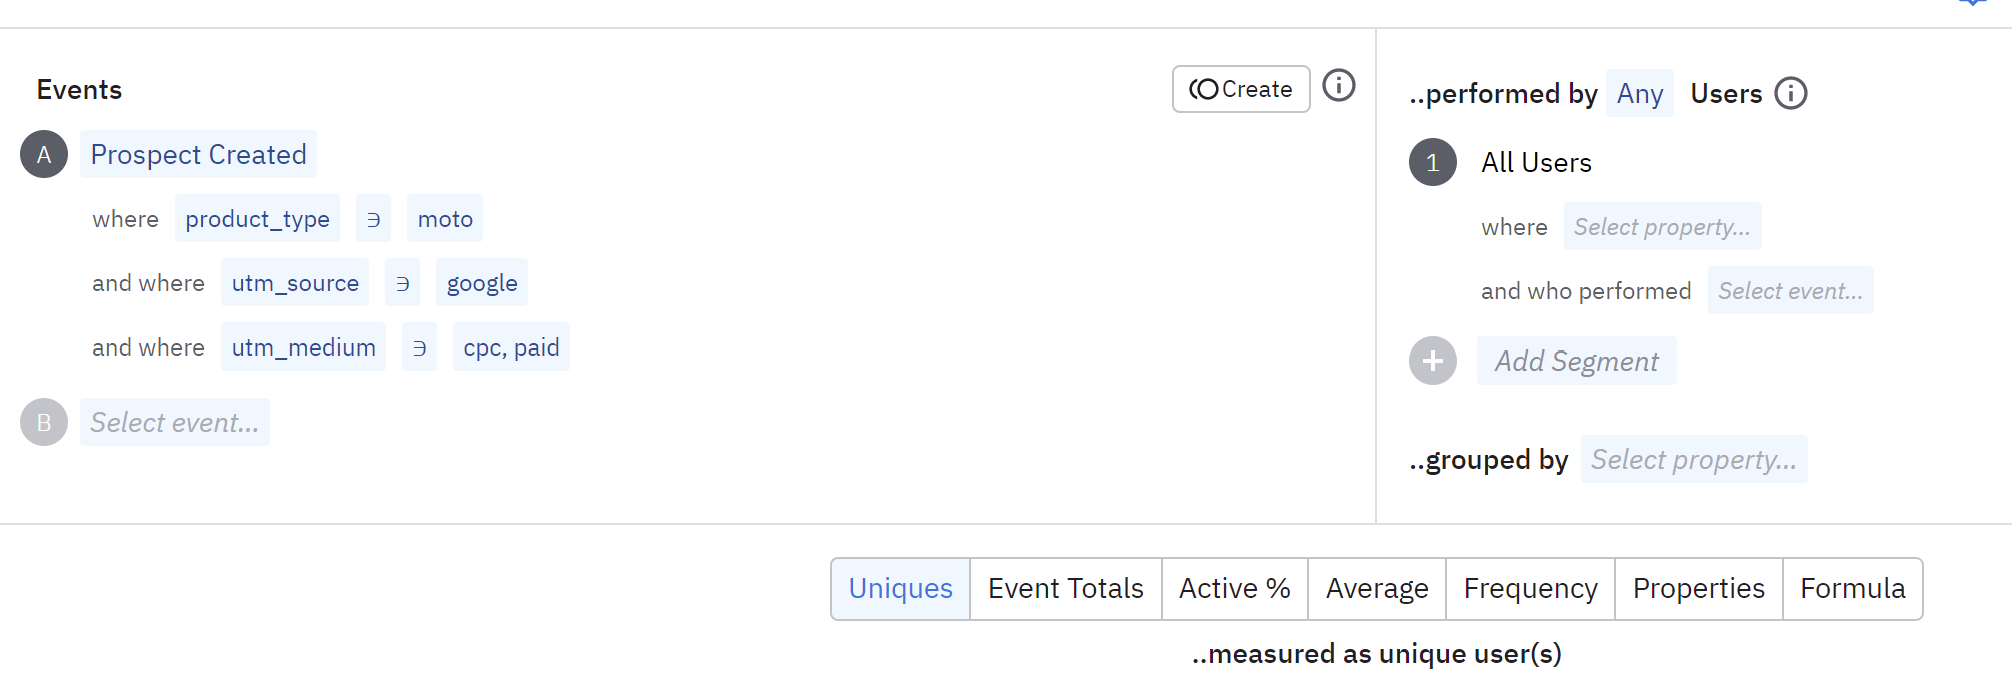
First scenario (filtering in the events side):
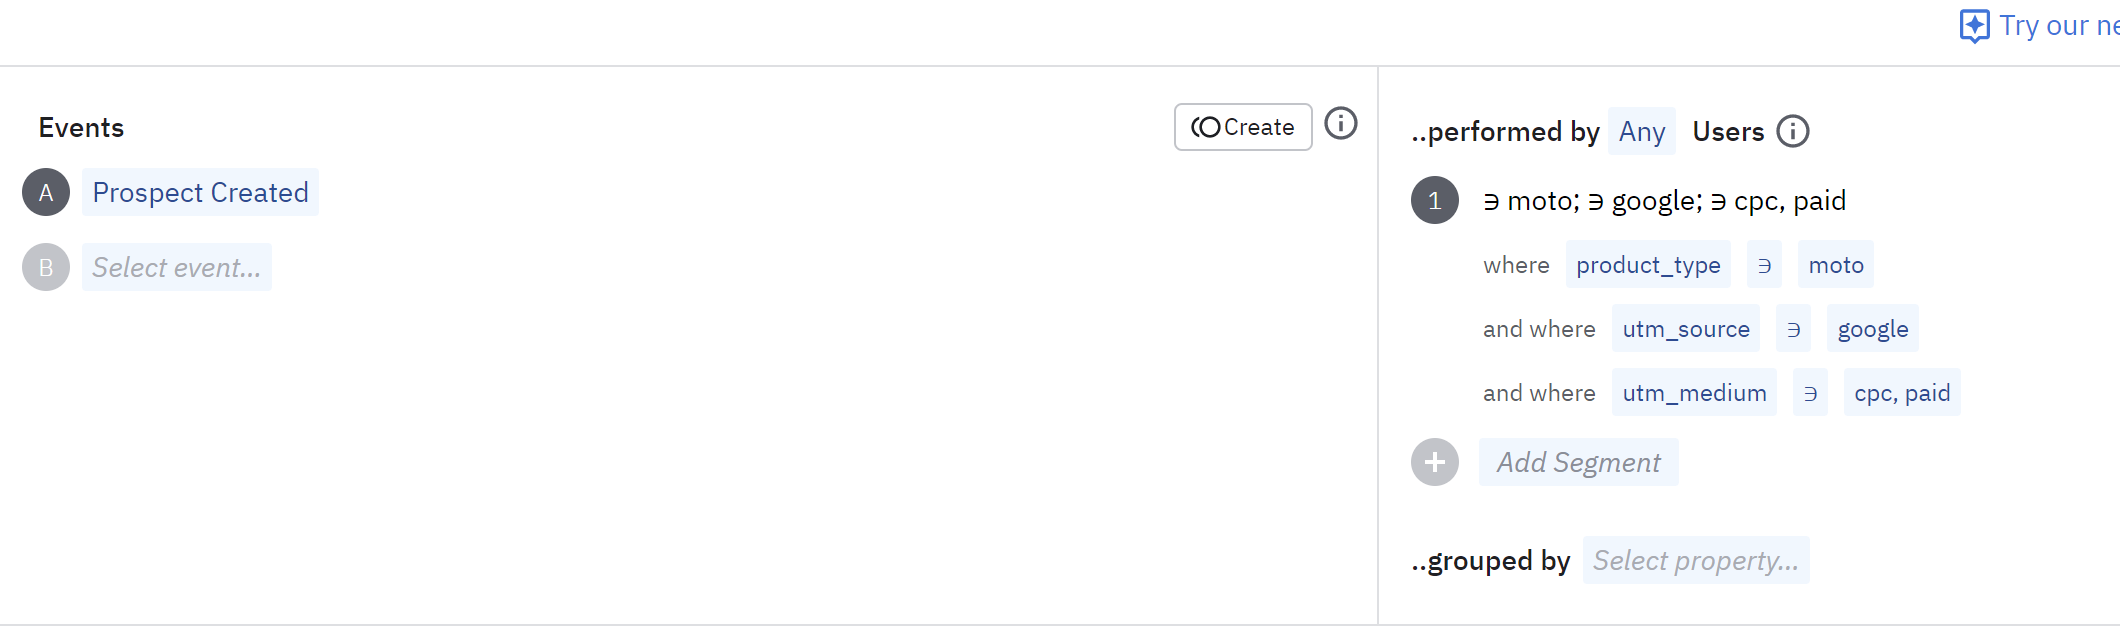
Second scenario (filtering in the user side):
Watching the results, I get 53 uniques yesterday in the first scenario vs. 46 uniques yesterday in the second scenario.
Thanks!
Thank you for circling back @trosen. We forwarded this to our support team who will be able to take a closer look.
Thanks @Jeremie Gluckman but we don´t have support since we are still in the free tier. That’s why we asked here in order to try to understand what is happening. Thanks!
Hi @trosen ! To clarify, Jeremie meant he was going to ping the Amplitude Support team to see if we can jump into the thread and take a look. Through that method, we are also able to find your organization and take a peek into your set-up.
Upon taking a look at your set-up, I noticed that you have product_type event property and a property_type user property. When I compared the data for Prospect Created with product_type event property vs a property_type user property, I see that the results do come out differently.
It’s possible that you are utilizing the event property version on your first chart but then only the user property version on your second chart. Because the data is different for these two properties, you therefore get different results. I can DM you the chart that I built to showcase the difference.
As for why the data would be different between the event property version vs the user property version, I recommend reaching out to your Engineering team who instrumented Amplitude to better understand this.
Hi @belinda.chiu thank you for clarifying.
Can you please DM me the chart you made? Because I’m seeing a difference eventhough I use user properties in each side when I do the comparison. I don’t even see the event property product_type when I’m selecting the filter.
Thanks!
Hi @trosen, happy to! I will send a message through our Support ticketing system with the specific chart. Please find a message in your email inbox.
Hi @belinda.chiu thanks for your answer! Now I get it. Nevertheless, I did send you an example where I can’t see the 2 properties.
Hi @trosen ! Awesome! Glad that showing the difference between the event property vs the user property version of “product_type” helped with understanding why there are different results and no problem!
I sent a follow-up regarding the issue about not being able to see the 2 properties. We’ll continue the conversation from there. In the meantime, I’ll change the Best Answer of this post to my response above!
If you don't have an Amplitude account, you can create an Amplitude Starter account for free and enjoy direct access to the Community via SSO. Create an Amplitude account. You can also create a Guest account below!
If you're a current customer, select the domain you use to sign in with Amplitude.
If you don't have an Amplitude account, you can create an Amplitude Starter account for free and enjoy direct access to the Community via SSO. Create an Amplitude account. Want to sign up as a guest? Create a Community account.
If you're a current customer, select the domain you use to sign in with Amplitude.


") and no problem!
and no problem! 
