I have a problem with X Axis customization in Segmentation Chart. For Retention chart it’s easy to set X Axis values to: Week 0 / 1 / 2 / 3 / 4 etc… For Segmentation Chart i have the X Axis customed by User segmentation (I’ve filtered users by the date of their account creation per weeks like 03-09 July / 10 - 17 July etc… and that is what i have on my X Axis). Is there any chance to custom it per days / weeks / months instead of dates for example?
Page 1 / 1
Hi @Hubert Danilczyk
The nature of the retention chart in itself is charting the retention rate against the weekly brackets.
The values on X axis can either be calendar days/weeks/months or the segment labels based on the type of chart visualization you choose in segmentation chart.
Selecting the line chart will overlay the metrics of your segments as per the daily/weekly/monthly time granularity
Let me know if I have interpreted your use case correctly. Hope this helps.
Hi @Saish Redkar
Thanks for your reply!
That is exactly what i need to do using Amplitude.
Imagine this case:
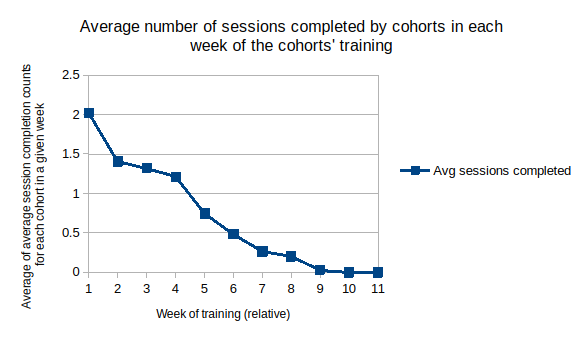
You are grouping users by their first training date - Users who has starterd between each week of July, August and September - so it’s around 12 Cohorts. (Users started between 01 July - 07 July ; 08 July - 15 July etc...)
Then you draw a chart, for each cohort starting from 0 value on X axis. Values on X axis are Week of training for each cohort (relative) - So you will have something like 12 different Lines starting from Value 0. The measure is Average of completed exercises per User in his Cohort.
The final thing is to draw average for these all Cohorts, so the Single line as above.
Please let me know, if there is any possibility to do this using Amplitude.
If you don't have an Amplitude account, you can create an Amplitude Starter account for free and enjoy direct access to the Community via SSO. Create an Amplitude account. You can also create a Guest account below!
If you're a current customer, select the domain you use to sign in with Amplitude.
If you don't have an Amplitude account, you can create an Amplitude Starter account for free and enjoy direct access to the Community via SSO. Create an Amplitude account. Want to sign up as a guest? Create a Community account.
If you're a current customer, select the domain you use to sign in with Amplitude.