I’m surprised I couldn’t find quite a basic function of creating a histogram for my events by the time they fired during the day - even hourly bins would be extremely helpful. Did I miss something, or it is impossible to create such chart yet?

Page 1 / 1
Hey
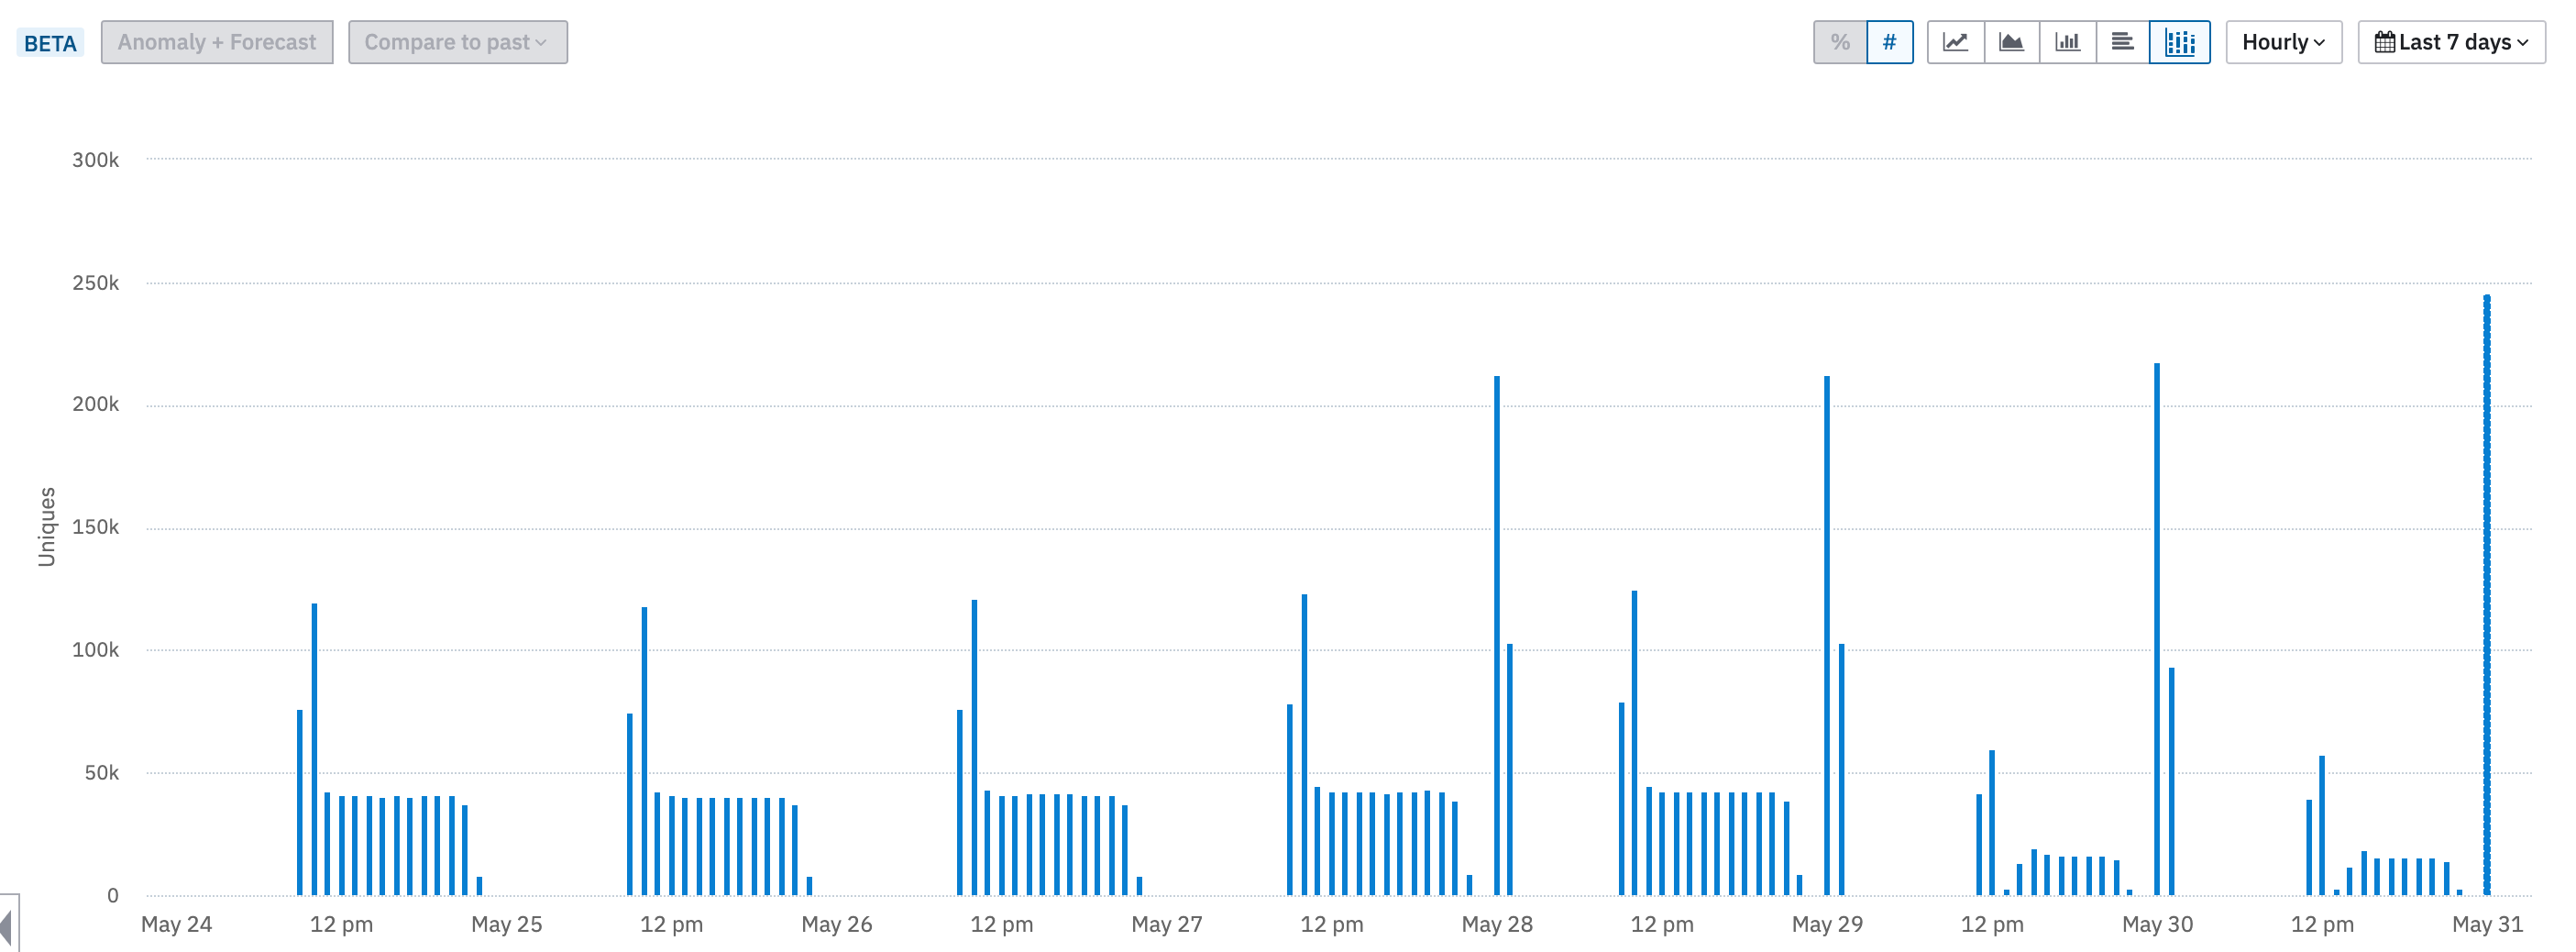
Thanks, @ning.chang! That’s certainly better than nothing. However, ideally, when I look at longer timeframes than a few days, I would rather see these histograms-per-day averaged out into a single histogram with averages per hourly interval. So I look at one chart instead of 30 mini-charts, if you know what I mean :)
Hey
Referencing a similar question which was asked before.
Hoping this might provide some additional help.
Reply


Welcome to the Amplitude Community!
If you don't have an Amplitude account, you can create an Amplitude Starter account for free and enjoy direct access to the Community via SSO. Create an Amplitude account. You can also create a Guest account below!
If you're a current customer, select the domain you use to sign in with Amplitude.
analytics.amplitude.com analytics.eu.amplitude.comor
Welcome to the Amplitude Community!
If you don't have an Amplitude account, you can create an Amplitude Starter account for free and enjoy direct access to the Community via SSO. Create an Amplitude account. Want to sign up as a guest? Create a Community account.
If you're a current customer, select the domain you use to sign in with Amplitude.
analytics.amplitude.com analytics.eu.amplitude.comor
Enter your E-mail address. We'll send you an e-mail with instructions to reset your password.