Hi Tristan,
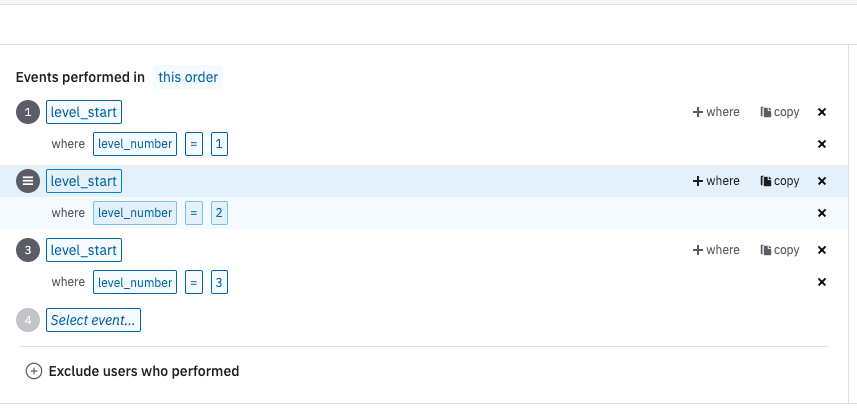
I gather you are hoping to build a Funnel Analysis within Amplitude that has several hundred levels (event name = level_start, event property = level_number). Amplitude allows for only 30 steps to be added to a Funnel. The best way to achieve what you are hoping to do is to list out each event with its event property as you are doing so in the screenshot you provided. We do not have a way to dynamically update the Funnel at each step (i.e. you plug in step (level_start) n+1 & the event property gets automatically added as level_number n+1). But I’ll take this feedback and pass it on to our Product Development team - so thank you! Feel free to read about building a Funnel Analysis here.
An idea would be to create a couple of separate charts and them add them to a Dashboard for easy viewing and comparison. You can find more information on Amplitude's dashboards here. For example, you could make one chart have the first 30 steps of the funnel, the next chart have the next 30 steps of the funnel, and so on. I understand this process is not ideal, but I hope this helps!
Best,
Julia


