Hi @Neha,
This is Yuanyuan from the Amplitude Support team - thank you for writing this post!
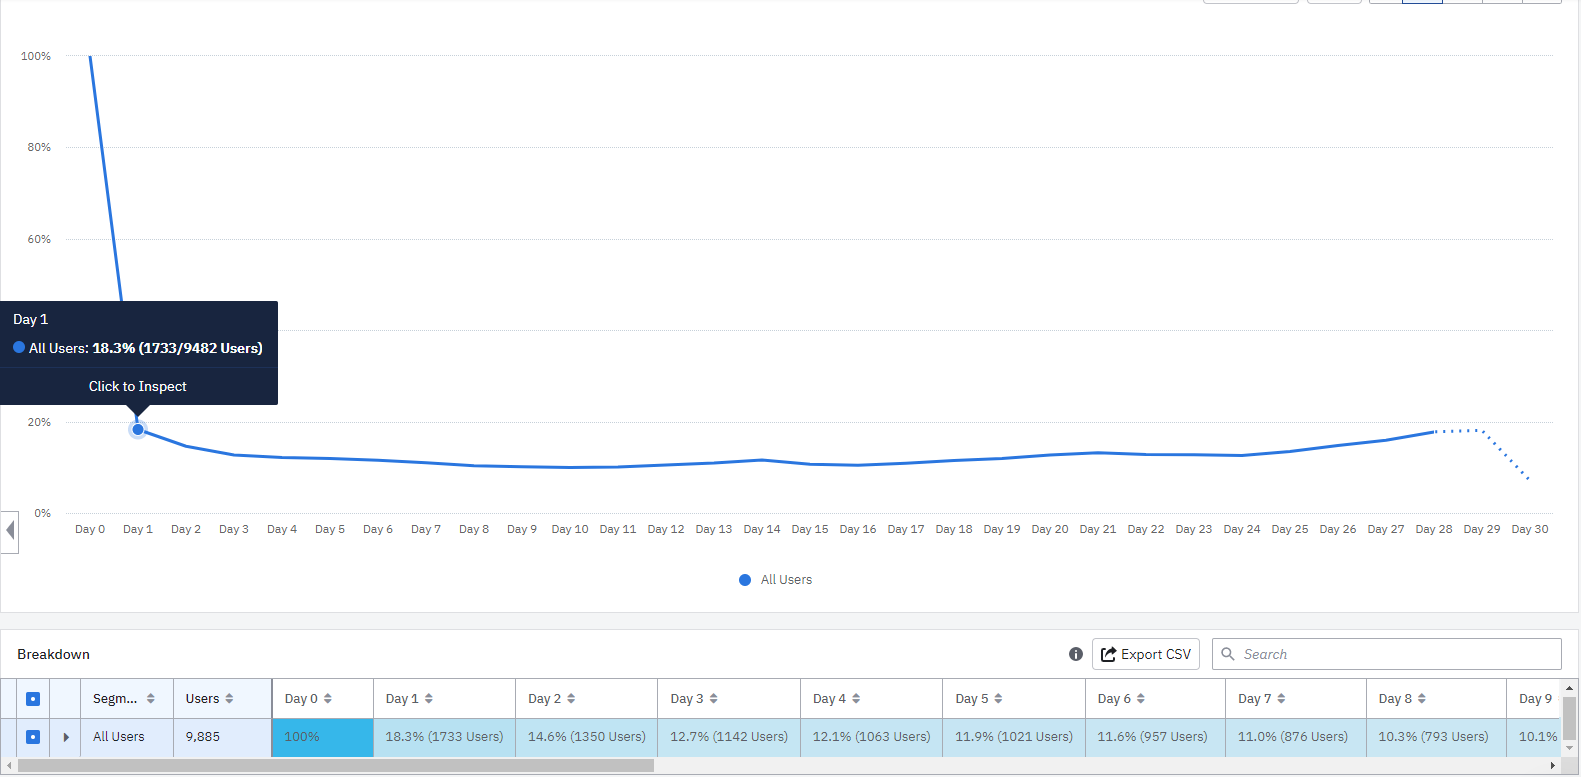
I understand you are asking why the denominator of users change over time and why day 0 denominator does not apply to later days, correct? This is a great question! I certainly understand why it can be confusing and would love to explain to you how our retention chart works.
This is because many users did not have enough time to reach later days yet. Day 0 denominator is the total number of users who fall into the retention chart at the moment when you look at the chart, but the denominator for later days in retention only count the users who have reached that day. For example, user A performed the starting event on June 1, and user B on June 8th. For User A, June 1 is day 0 and June 8 is day 9. This user will be counted in the denominator from day 0 to day 9 although we are looking at until day 30 retention. For user B, as this user just started today, they will only be counted in Day 0 denominator.
Does this help? Please let me know if you have follow-up questions!
Best,
Yuanyuan
Oh, it makes sense now. Thank you!