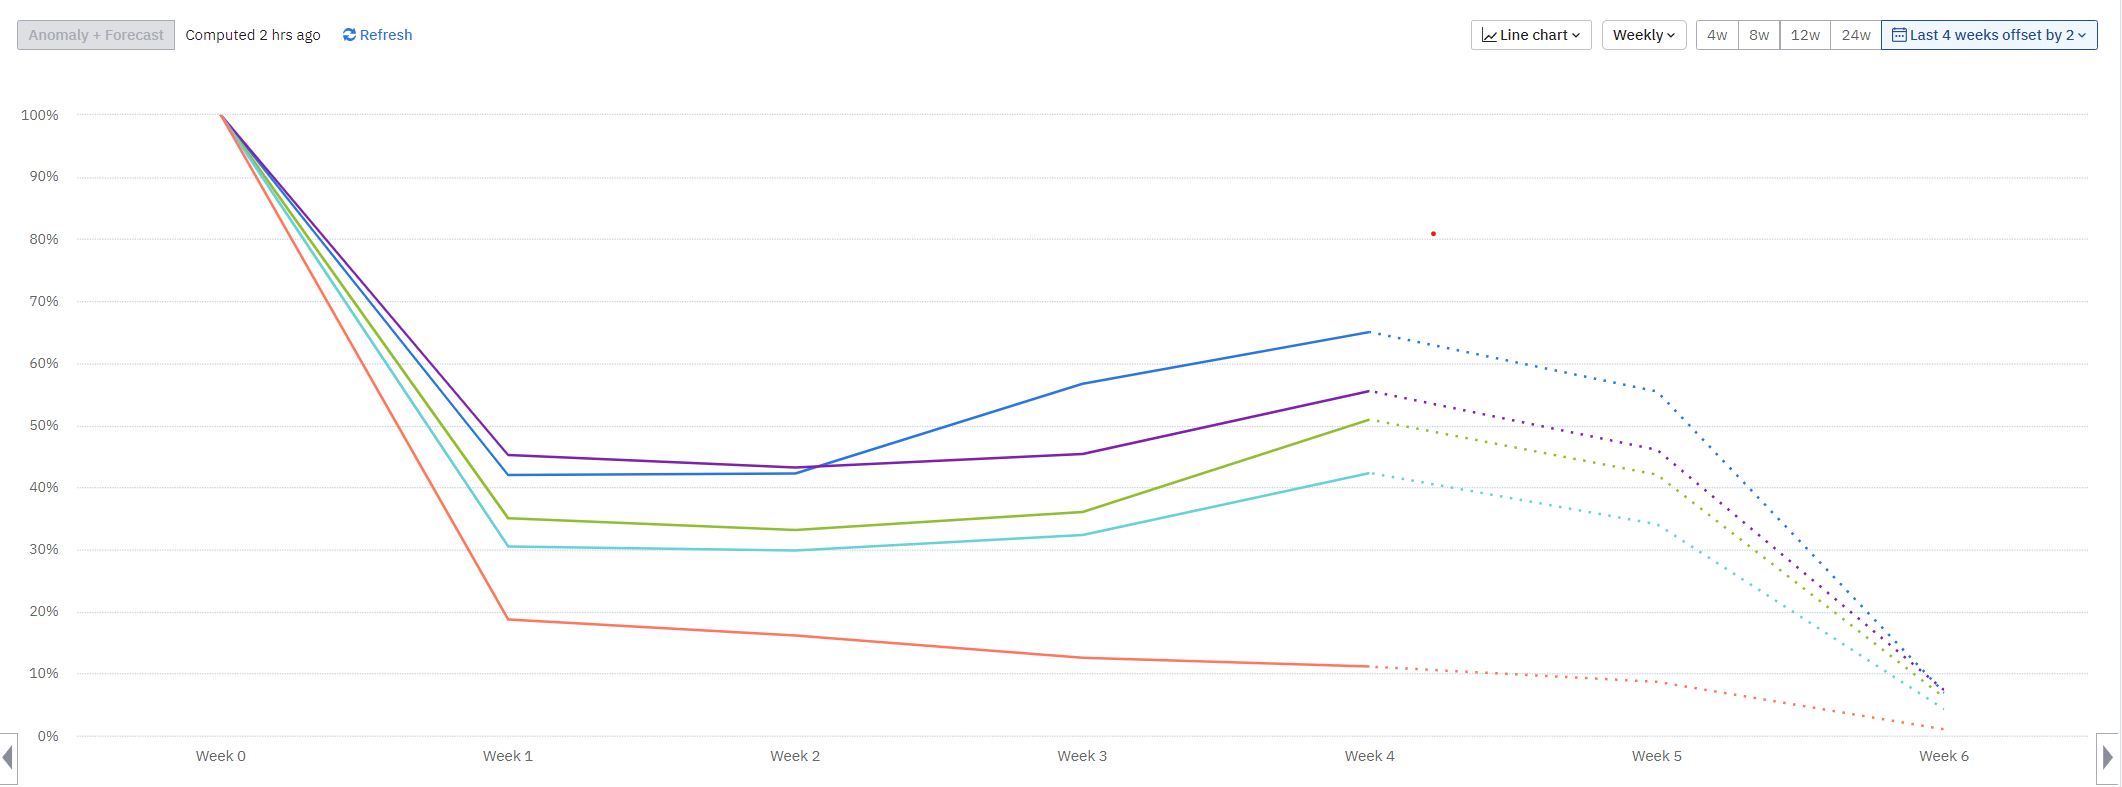
I’m trying to understand the Weekly retention of people in a certain cohort. However, I’m getting these numbers that raise over the given weeks. I know one of them is due to lack of data in those time periods, but most of them have been implemented for quite a while now, so this increase doesn’t seem expected.
I am suspecting it has to do with the way the Cohort is setup. These are If User performs X more than 1 time within 30 days kind of cohorts. This led me to wonder, how do Cohorts of this nature work with a chart window that is bigger than the defining cohort.
Example: Cohort where user performs event X at least once in 30 days. But I’m charting weekly retention over 12 weeks.
Does the retention track what the dynamic cohort population was from week 1, and re-calculate it for each week? Or does it take one single measurement of what the cohort users are, and measure retention based off of the very first week’s users?
Hope this question makes sense.
Thanks in advance.
-Justin
Page 1 / 1
I’m trying to understand the Weekly retention of people in a certain cohort. However, I’m getting these numbers that raise over the given weeks. I know one of them is due to lack of data in those time periods, but most of them have been implemented for quite a while now, so this increase doesn’t seem expected.
Typically these kinds of situations are caused by uneven sample sizes. Here is a post that explains this in more detail:
I am suspecting it has to do with the way the Cohort is setup. These are If User performs X more than 1 time within 30 days kind of cohorts. This led me to wonder, how do Cohorts of this nature work with a chart window that is bigger than the defining cohort.
Example: Cohort where user performs event X at least once in 30 days. But I’m charting weekly retention over 12 weeks.
Does the retention track what the dynamic cohort population was from week 1, and re-calculate it for each week? Or does it take one single measurement of what the cohort users are, and measure retention based off of the very first week’s users?
Cohorts take in all cases, including these, the users that currently match the cohort criteria and runs the query for them. So it does not process the cohort separately for each analysed week.
This can be a big contributing factor to creating these uneven sample sizes, but it’s impossible to tell without knowing more details about how you have set this up.
I agree with @MikkoKarvonen , this is often caused by uneven sample sizes which would cause this sort of set up. This would cause some numbers to inflate.
It is not uncommon to see retention going up, especially if your selected timeframe includes incomplete data points. The main reason why the retention is going up is because we are dealing with uneven sample sizes for each "day" of retention when the date range is very recent.
For example, User A became a new user on September 30th. This user would be counted in the denominator of the Day 1 retention rate because this user has had the opportunity to be Day 1 retained. However, this user would not be counted in the Day 10 metric because today is October 2nd and the user hasn't had the opportunity to be Day 10 retained yet. User A is completely excluded in the calculation of Day 10 retention.
The line graph will show you the weighted average of all the retention numbers from the user cohorts within the selected time frame. You can see the data for each individual cohort in the table below the chart. Your unbounded retention chart is going up because the user cohorts who joined later are given less time than previous cohorts to retain. Their numbers are lower, which results in higher percentages (temporarily).
If you do not wish to see incomplete data points on your chart, I recommend modifying the date picker to include only users who have had the opportunity to be Day 30 retained (example chart here).
I hope this helps. Let me know if you have any questions!
If you don't have an Amplitude account, you can create an Amplitude Starter account for free and enjoy direct access to the Community via SSO. Create an Amplitude account. You can also create a Guest account below!
If you're a current customer, select the domain you use to sign in with Amplitude.
If you don't have an Amplitude account, you can create an Amplitude Starter account for free and enjoy direct access to the Community via SSO. Create an Amplitude account. Want to sign up as a guest? Create a Community account.
If you're a current customer, select the domain you use to sign in with Amplitude.