Solved

How can I see all CTA conversion rate in the same chart

  • 16 February 2022
  • 2 replies
  • 200 views

Badge

Hi, 

I have multiple CTA on the page and I want to know each one’s conversion rate.


To compare CTA fairly, I use the element visibility as each conversion’s denominator so all CTA have different denominators.


I create multiple funnels for each CTA now, which is inconvenient to see the overall performance.


Is that possible to compare different conversion rate in one chart? (like each bar has its own custom calculation so I can compare all CTA in one chart)


Thanks!

icon

Best answer by SheenaGreen 18 February 2022, 02:30

View original

2 replies

Userlevel 4
Badge +8

I imagine you have 2 events, something like View CTA and Click CTA. As long as these events share an event property that identifies the CTA, you should be able to visualize the data in the way you are hoping to. 


Funnel analysis would look like:

Step 1: View CTA 
Step 2: Click CTA

In the analysis configuration, hold constant the CTA identifier and break down the results by Step 1: CTA Identifier. Holding constant the CTA identifier means the value of this event property needs to be the same at step 1 and at step 2 for the conversion to count.


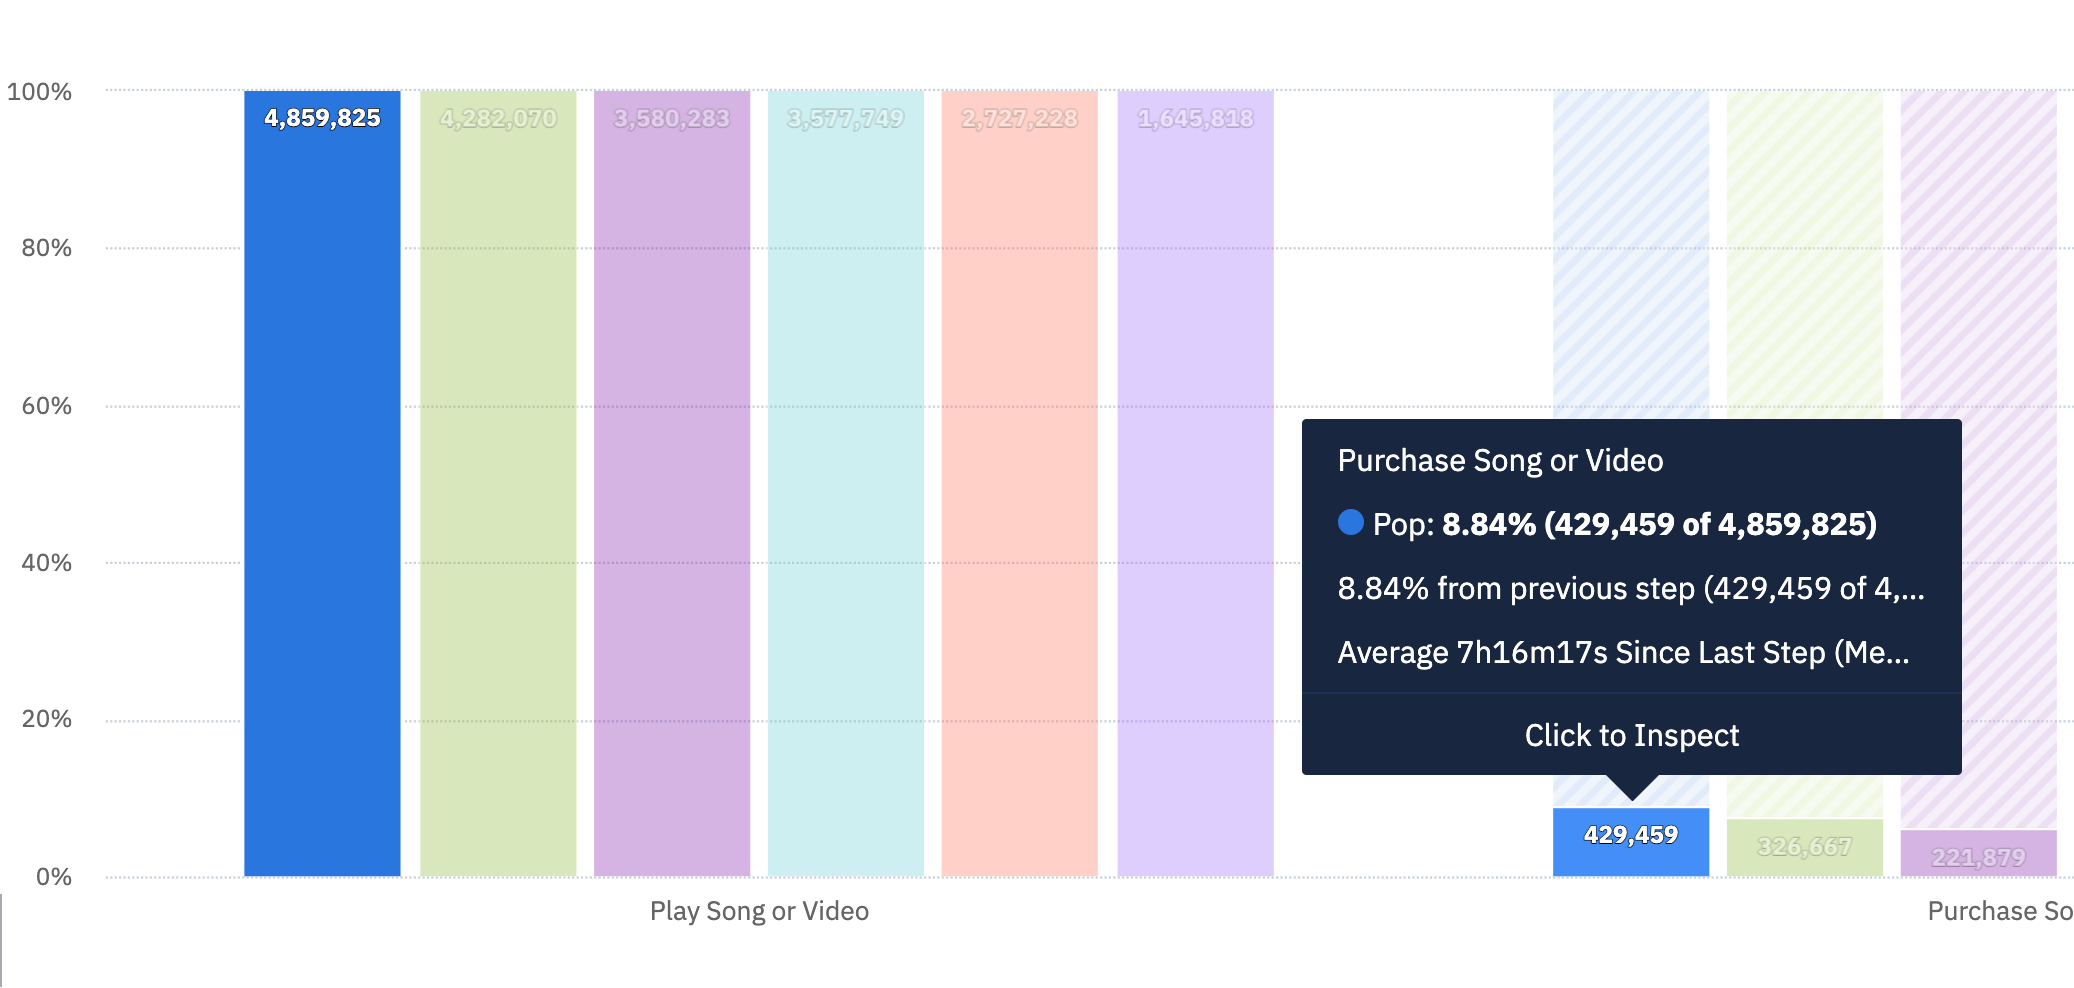
Here’s an example using Amplitude’s demo data. Play Song or Video and Purchase Song or Video share an event property called Genre_Type: https://analytics.amplitude.com/demo/chart/new/wwe7oc9


So for example, the below shows that 4,859,825 users played a Pop song and 8.84% of them went on to purchase a Pop song. 


Hope this helps!

Badge

Thanks! I will try it out.

Reply