How can I create this Dashboard? Is it done with formula?
Hi, I have been looking through the Demo dashboard
and I was wondering
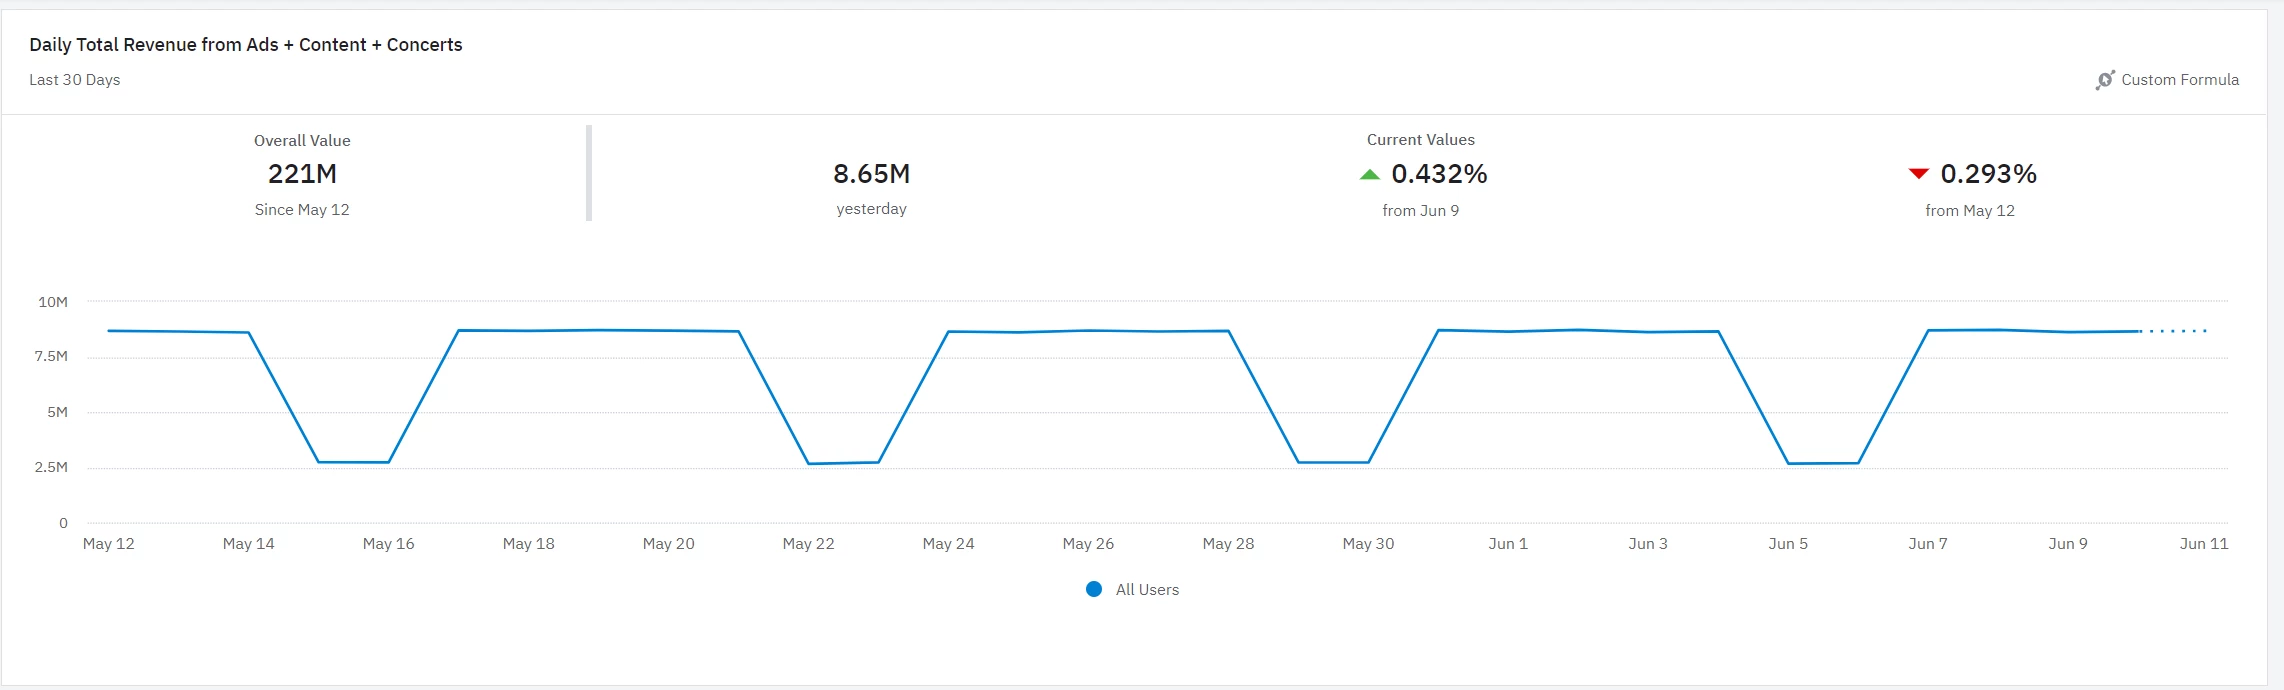
How can I create the number section above the graph?
oveall value, yester day, vs current values,vs from May12
this part.
the chart format is custom formula, so I tried to copy and past the formula to the event segment
chart, but it didn’t work.
How can I create this type of, ‘showing the important number above the graph’ dash board?
thanks
Page 1 / 1
Hey @flor.cho We can display any event segmentation chart, conversion Funnel charts and User Session charts as a chart, a table, or a single KPI after they are added to a dashboard.
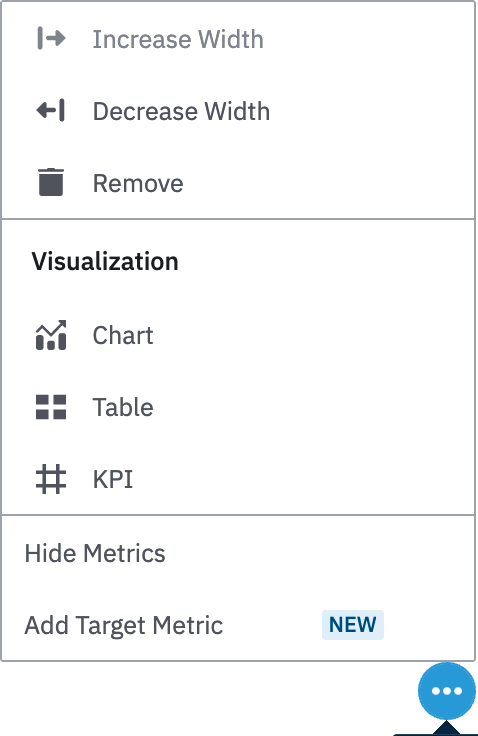
You can just click ••• in the lower-right corner of your chart on the dashboard and select your preferred option.
You can then choose the chart option and toggle between Hide Metrics and Show Metrics.
Here is a detailed explanation of how you can customize a dashboard’s display.
Let me know if this helps!
Hi and thanks to you both!
yes, and that was helpful.
but when I clicked “Add target Metric” the only adjustment that I can manage was
target number, and all the other part were automatically set.
If I would like to show the specific number and the chart together in one chart, is there other way to do it?
Also, I would like to show
“Daily install per country for last 30 days”chart with property of country.
and I would like to show daily install number in total, not for one property
but seems like by using this “add target metric” I can only select one of the property to show the specific number
Can you let me know is there any other way around to do this?
thanks
with best regards, flor Cho
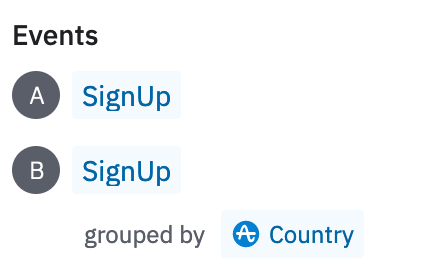
I’m not 100% sure I get what you want to see, but would setting up your chart like this help?
Hey @flor.cho , Based on what I have observed , the Show Metric feature on a dashboard behaves differently depending if the chart in question is grouped by on a property or not.
Since you want to group by on the country property, the choice of metrics of “Overall Uniques” and “Current Value” will only be limited to a particular segment that we can choose i.e a given value of the country and displayed over the chart.
Assuming that your use case is showing “Daily install per country for last 30 days with property of country” and “daily install number in total” in a single chart , Mikko’s suggestion would be a good one. If you want that chart to be shown on a dashboard in the metrics view, then you would only have the option of showing metrics for either the total number of daily installs or installs be one particular country and not both.
From what I’m see, we can only use the “add target metric“ for overall uniques or current value and not really set context on which property value we want to set the target on if the chart uses a group by.
If you don't have an Amplitude account, you can create an Amplitude Starter account for free and enjoy direct access to the Community via SSO. Create an Amplitude account. You can also create a Guest account below!
If you're a current customer, select the domain you use to sign in with Amplitude.
If you don't have an Amplitude account, you can create an Amplitude Starter account for free and enjoy direct access to the Community via SSO. Create an Amplitude account. Want to sign up as a guest? Create a Community account.
If you're a current customer, select the domain you use to sign in with Amplitude.