Hi, hope this is the right thread to ask this..
I spent half of the day experimenting and thinking how to achieve chart that I want - unsuccessfully..
I want to know: How many unique users change same entities in our system.
In my domain we have entity (Campaign). It’s accessible for multiple users.
Campaign has an ID (unique per campaign), I get ID with with Save event in event props. Next to that I have user info as well like Profile Name/Id etc..
Now the ultimate goal is to know how data is distributed - how many people usually Edit and Save single campaign.
So eventually to know how many people usually work on single entity during entity lifecycle.
Currently I have this view by simply:
- Go to Event Segmentation
- Select Save event
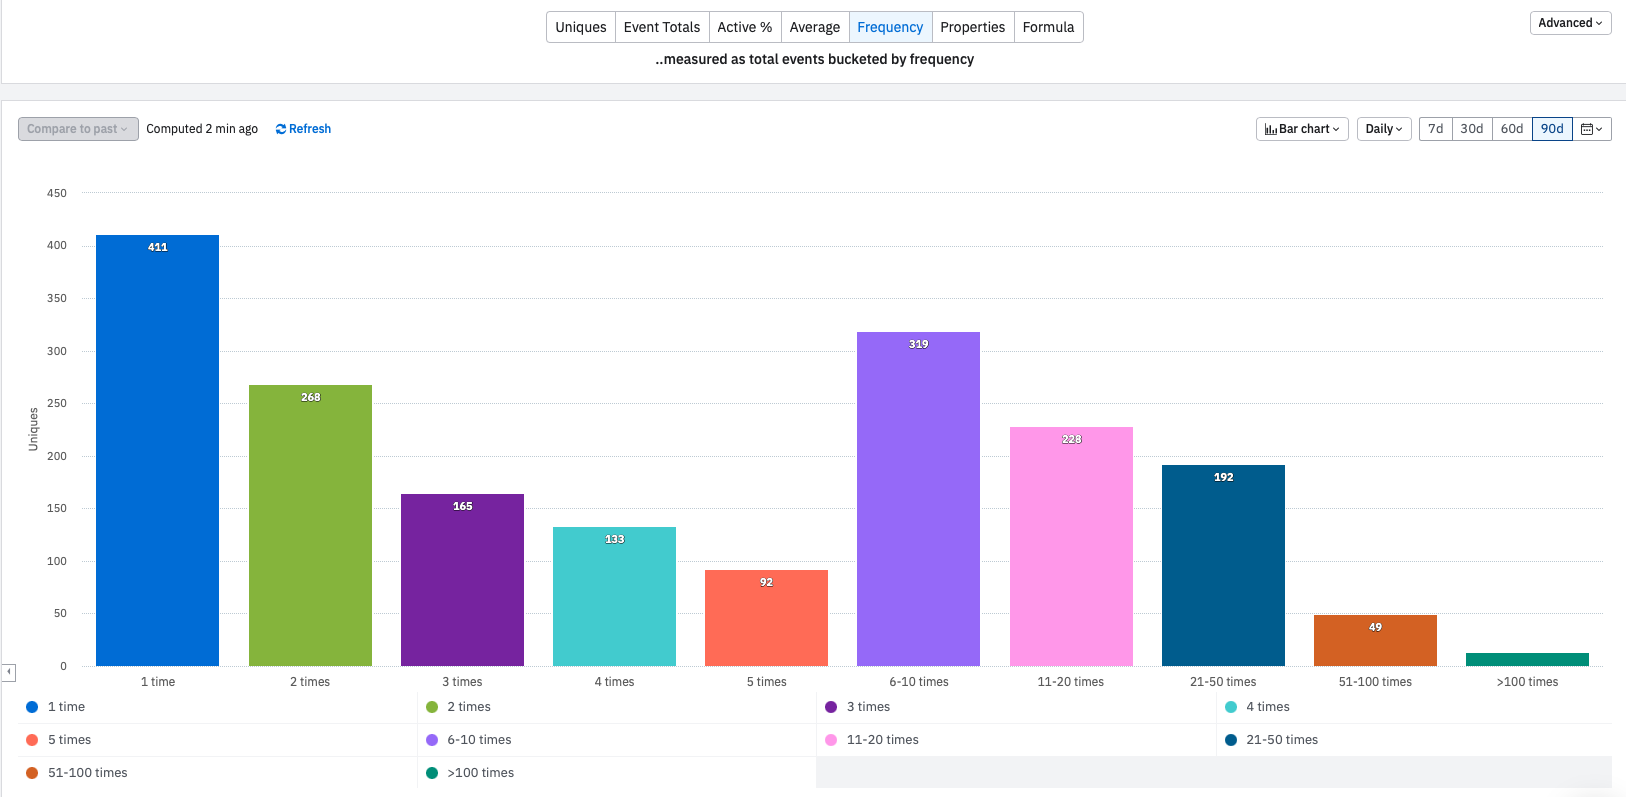
- Select Frequency
And I assume it already shows split of how many times Campaigns are edited (but still I’m not sure if this is true since adding where and selecting all available IDs changes my results)
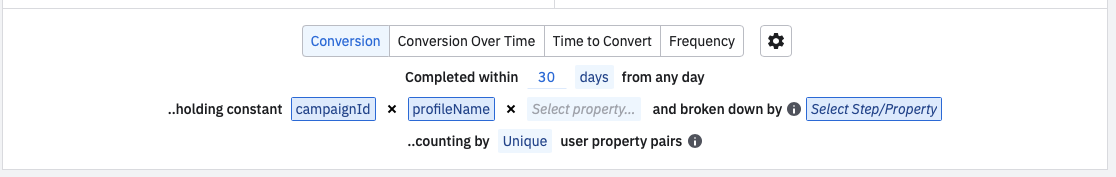
Anyway, any suggestion how I should build my query so I see similar split for Unique users aditing the same campaign?
I assume X axis is:
- 1 user
- 2 users
- 3 users
- etc…
and Y axis is:
- number of campaigns (for selected period)
Thanks a bunch!