Solved

[Dashboard API] Segmentation for users, who performed another event

  • 26 January 2022
  • 2 replies
  • 217 views

Badge +1

Hi, everyone. I didn’t find the answer either in docs or community.

The desired result is:

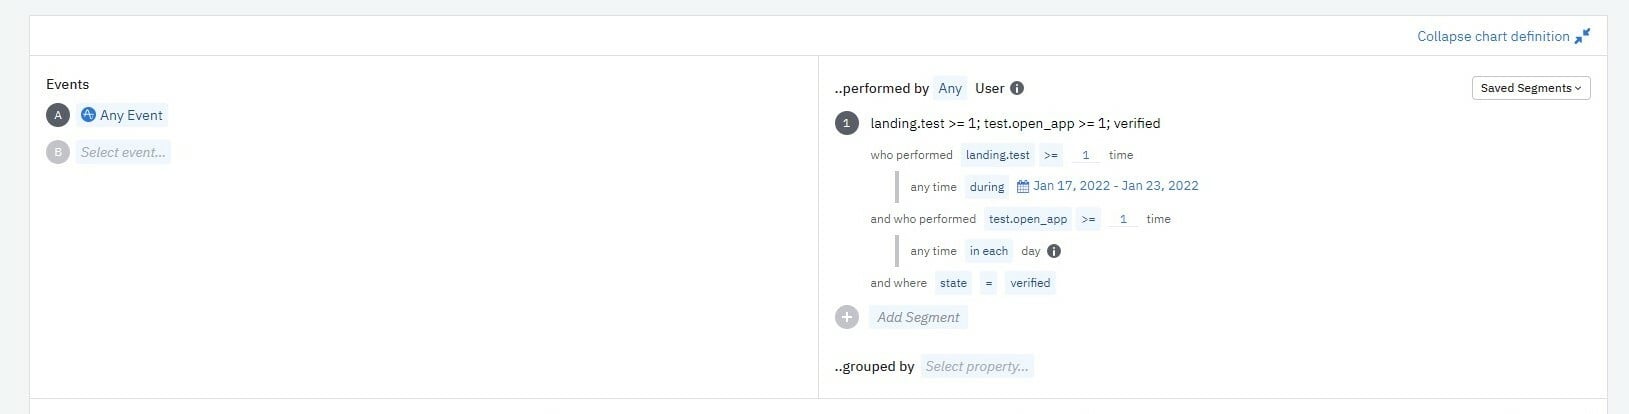
How to create the request?

My event data is:

const eventData = {
"event_type": "_all"
};

What segment definition should be?

I’ve found some information about segments here. So, my definition looks like this:

const s = [{
group_type: "User",
prop: "gp:state",
prop_type: "user",
op: "is",
type: "property",
values: ["verified"]
},{
op: ">=",
type: "event",
event_type: "landing.test",
filters: [],
value: 1,
time_type: ???,
time_value: ???
}, {
op: ">=",
type: "event",
event_type: "test.open_app",
filters: [],
value: 1,
time_type: 'forEachInterval',
time_value: 30
}]

I’m not sure about this construction.

What are all the available values for “time_type”?
Why I should specify 30 for the “forEachInterval”?

Can someone tell me more about “group_type”, ‘prop_type’, ‘type’, ‘event_type’? This parameters are not specified in docs.

Thanks for any help!

icon

Best answer by eddie.gaona 27 January 2022, 02:01

View original

2 replies

Userlevel 5
Badge +9

Hello @gapon2401 happy to help!


There are a couple of ways to get the results you are looking for that could save you cost as the Dashboard Rest API has restrictive limits:


  1. Use the Results from an Existing Chart endpoint. Since the chart is already created in the Amplitude UI you can pull the information programmatically using this endpoint. As mentioned, the main reason I present this option is that it will save you cost on the Dashboard Rest API limits.
  2. You can definitely try building out the chart as an API call and it will have a higher cost than the above option. I will be using this Demo chart that is setup similar to the screenshot you provided: https://analytics.amplitude.com/demo/chart/new/xj3emx2
    • The Segment definition would be as follows:
      • Purchase Song or Video: {op: ">=", type: "event", event_type: "Purchase Song or Video", filters: [], value: 0, time_type: "forEachInterval, “time_value”: 30}
        • The reason for the 30 is because the chart is looking at the last 30 days.
      • Play song or video: {op: ">=", type: "event", event_type: "Play Song or Video", filters: [], value: 1, time_type: "absolute",
        time_value: [1642377600, 1642982399]}
        • The time_value is the time in epoch “in between Jan 17 - Jan 23, 2022.

In summary using your example,

{
op: ">=",
type: "event",
event_type: "landing.test",
filters: [],
value: 1,
time_type: absolute,
time_value: [1642377600, 1642982399]
}

Hope this helps!

Badge +1

Thank you @eddie.gaona! Everything works as expected!

Is it possible to enlarge the request limits to dashboard API?

Reply