
RANGES for Frequency
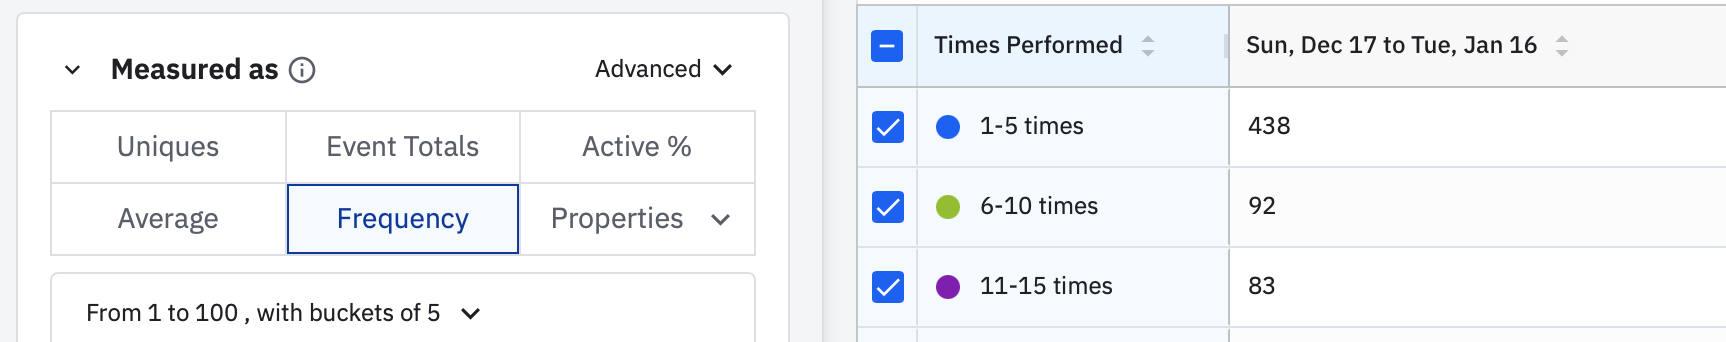
The Ranges feature works great.  Here’s an example.
Segmentation: Song Plays measured as Frequency with custom bucket size of 5.
PROPSUM
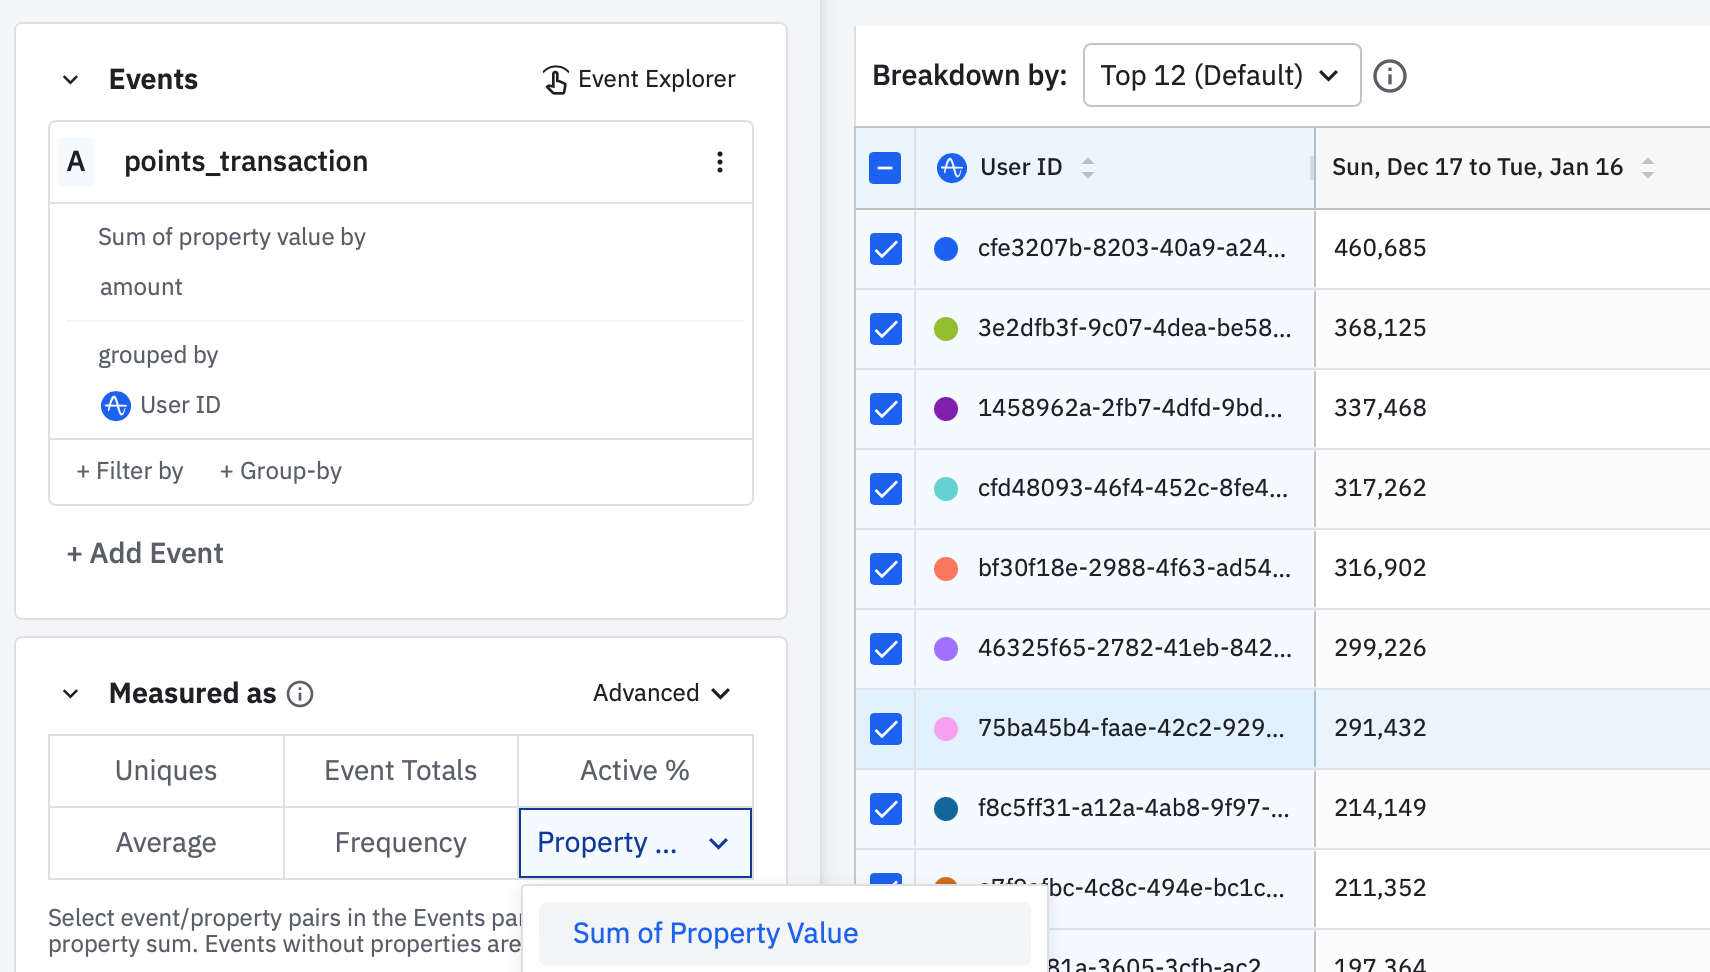
The Propsum feature also works great! Here’s an example.
Segmentation: PROPSUM of points by user
PROPSUM Ranges
Is there a way to count my users by the sum of their points in ranges 
Example: Sum of Points - Point Range measured as Frequency with custom bucket size of 10,000 pts
- 0-10,000 pts: 12,000 users
- 10,001-20,000 pts: 20,000 users
- 20,001-30,000 pts: 15,000 users
Thanks,
Anthony

