Hi Everyone!
I am trying to figure out how to ungroup the frequency from 6-10 days to 6 times 7 times 8 times 9 times.
Hey LeoM
Afaik, currently there is no direct way to customize the buckets generated by the frequency metric in the event segmentation chart. The 6-10 days bucket is auto generated by this chart.
This could be a good feature idea and you can try putting this in front of the Product Team by submitting the request in here.
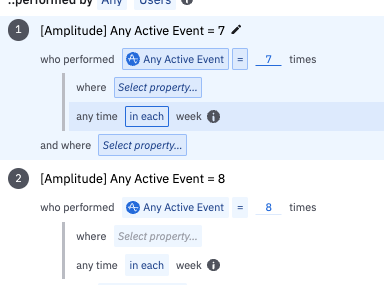
A long shot approach will be to try creating user segments with actual event count in the time bound interval using the in each clause. But I suspect this may come with some caveats and you might not be able to create the exact interpretation as the frequency metric.
Hope this helps.
Hi, When I add a chart (widget) to my dashboard, and then go to the content and modify the chart (I user another type for exemple) and save, my dashboard doesn't reflect the latest modification. Would you by any chance know why ? Thank you
Hi, I am doing a simple analysis : number of views for each pages of my website. So I use Segmentation but I always end up with a chart AND the table below. I want to display only the table (easier to read). Is it possible and how ? Thank you
We implemented first party tracking using the basic JS SDK on the browser and pointing the payload to our servers like this: amplitude.init(AMPLITUDE_API_KEY, { serverUrl: serverUrl, autocapture: { attribution: { excludeReferrers: [/domain1\.com$/, /domain2\.com$/], }, formInteractions: false, fileDownloads: false, }, });…
My Android app is primarily a background app. Does Amplitude track events for such an app? Please let me know.
here is the referance graph: https://app.amplitude.com/analytics/demo/chart/new/363tk5og In this graph, retention is currently being calculated based on the next day, but I want to analyze it based on the previous day instead. Example: For July 27, we should compare retention against July 26, not July 28. * So for 1-day…