But can the value still increase after a long period of time?
Page 1 / 1
Hi @Willy ,
Thanks for writing into Amplitude Support! Are you backfilling any events in? One thing I can think of is if any of the events are being backfilled at a later point and therefore, will increase if you are sending in past events later.
Another option might be that users have done events offline and then connected to the internet after some time and uploaded the events.
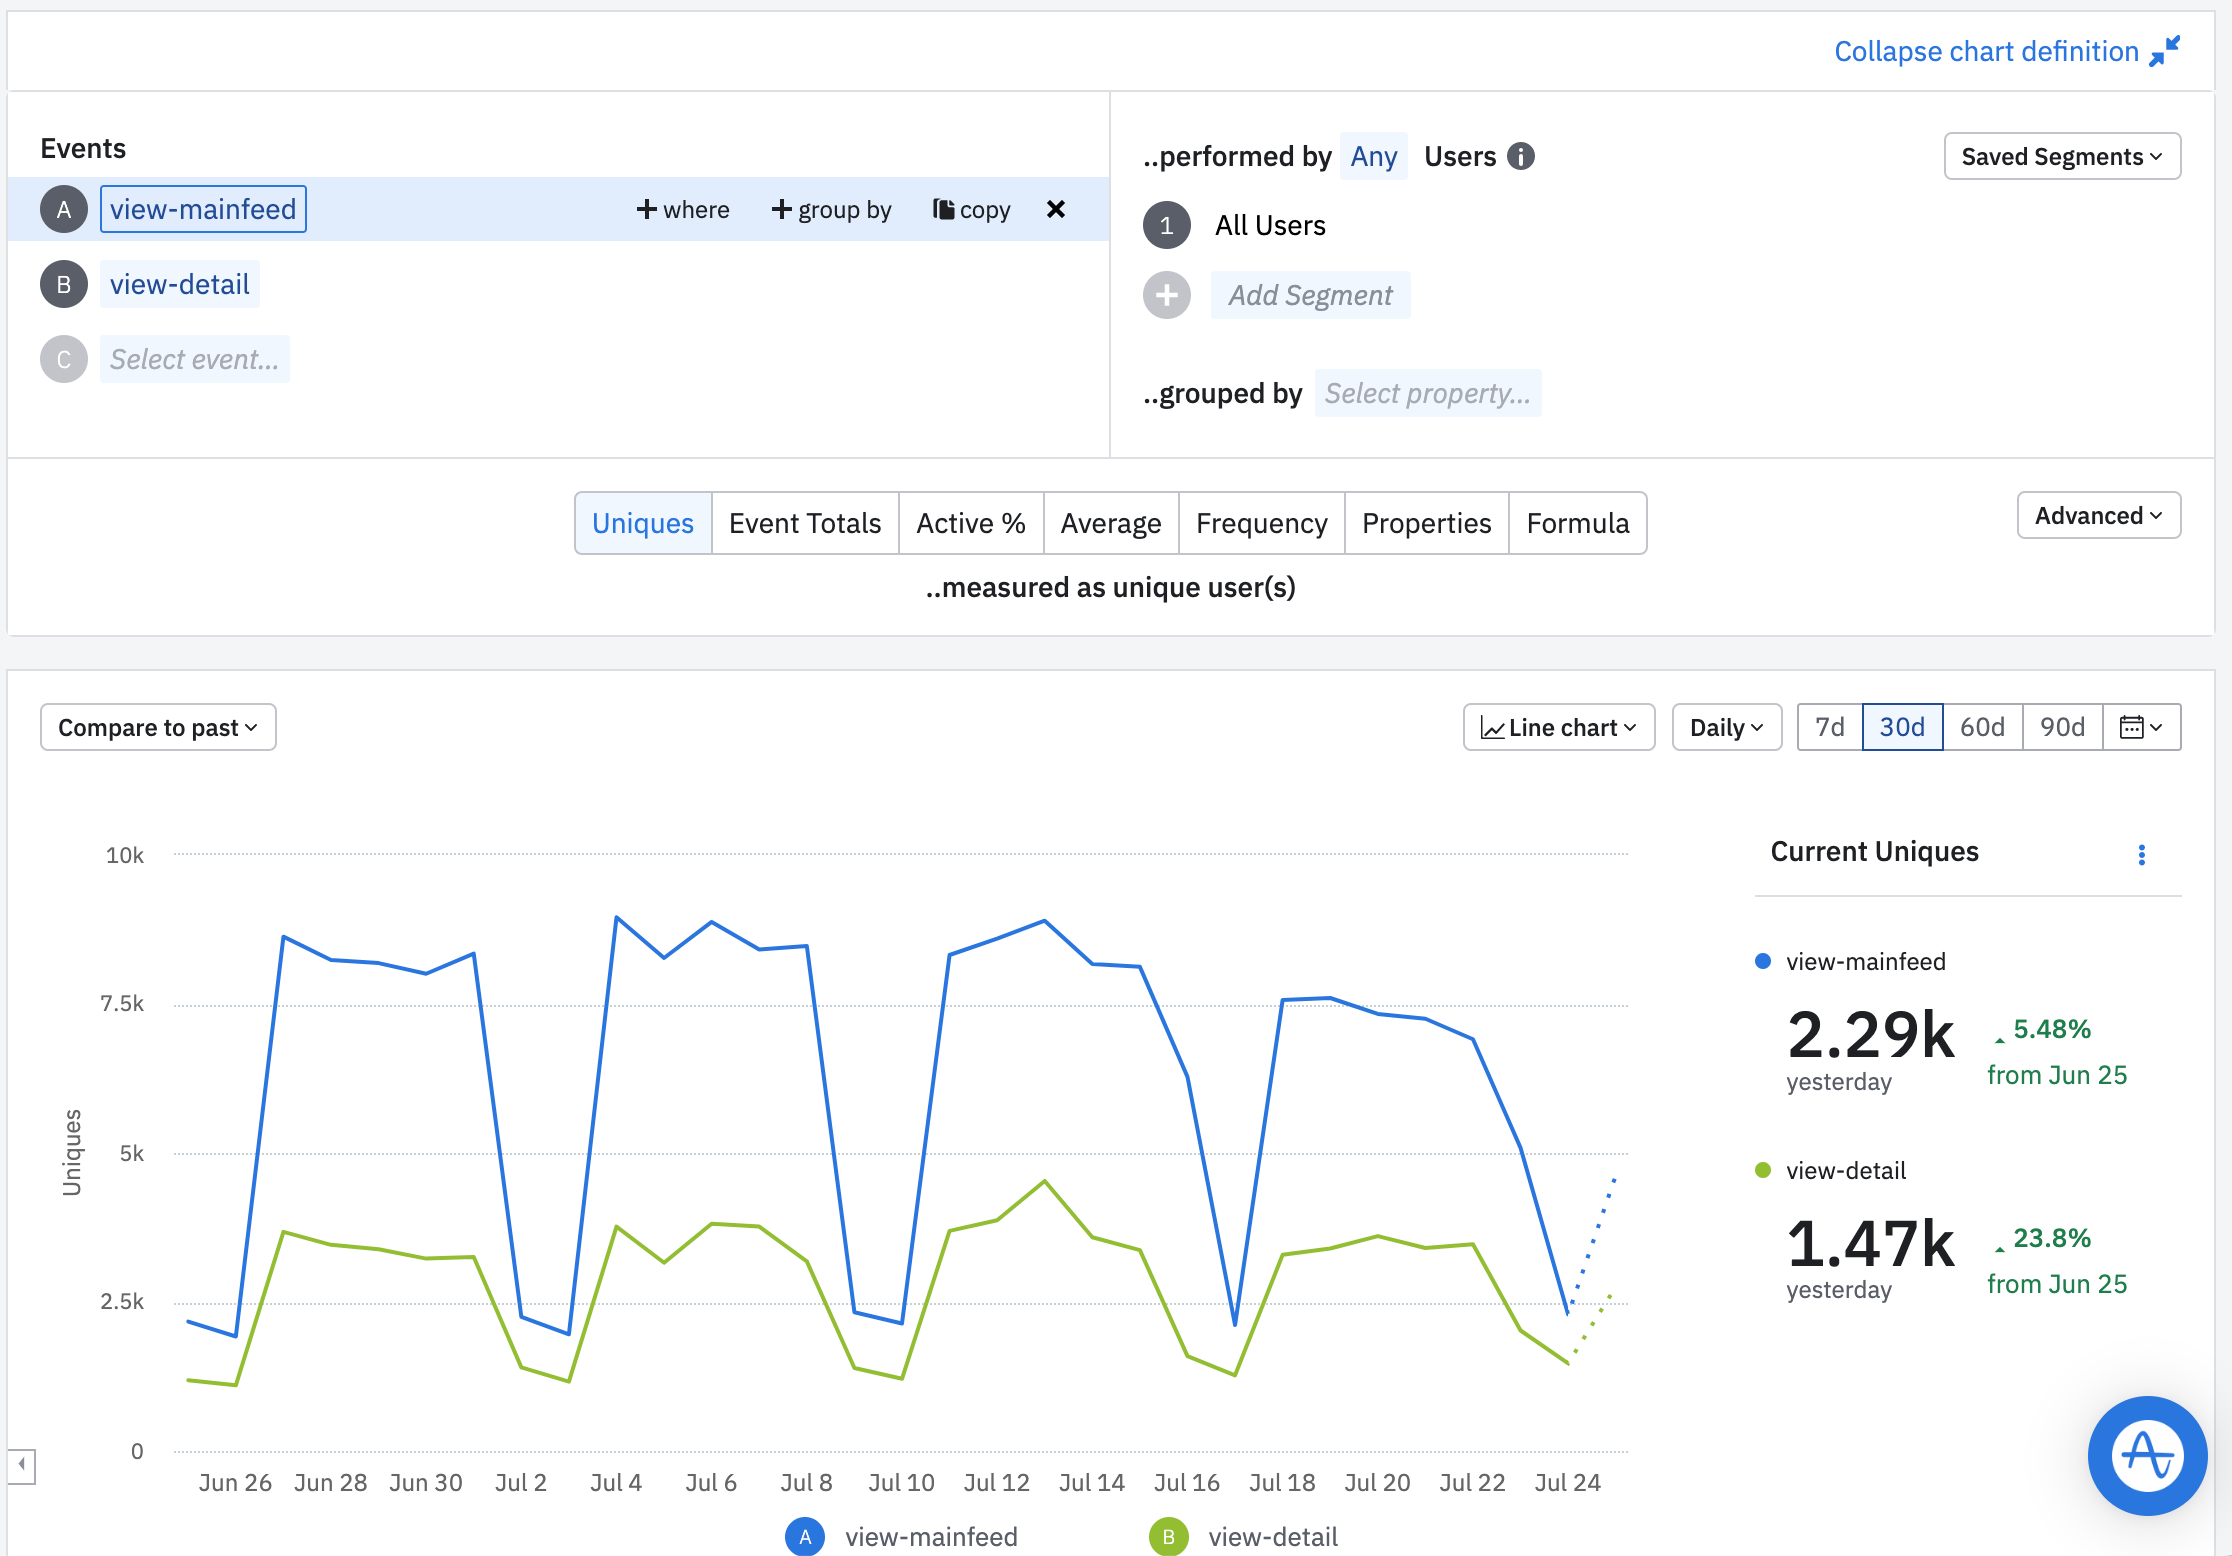
Another option might be an implementation issue of some sort. Do you have a chart you can link to me here as in the screenshot? I can then take a look at the events for you and see if there is anything unusual. I would also recommend upgrading to the latest SDK, just to be sure.
Kind Regards, Denis
Hi @Denis Holmes
Thanks to reply.
This is the link to our chart. I don't know if it can be accessed from outside. attach a screenshot
I have adjusted the time because I am looking at asia/seoul standards.
Q2. If we want to see the data between 6/30 ~ 7/1, are the params of the above url request correct?
- Is event_time the standard for start and end of export api? - When displaying by date in the chart, is event_time the standard as well?
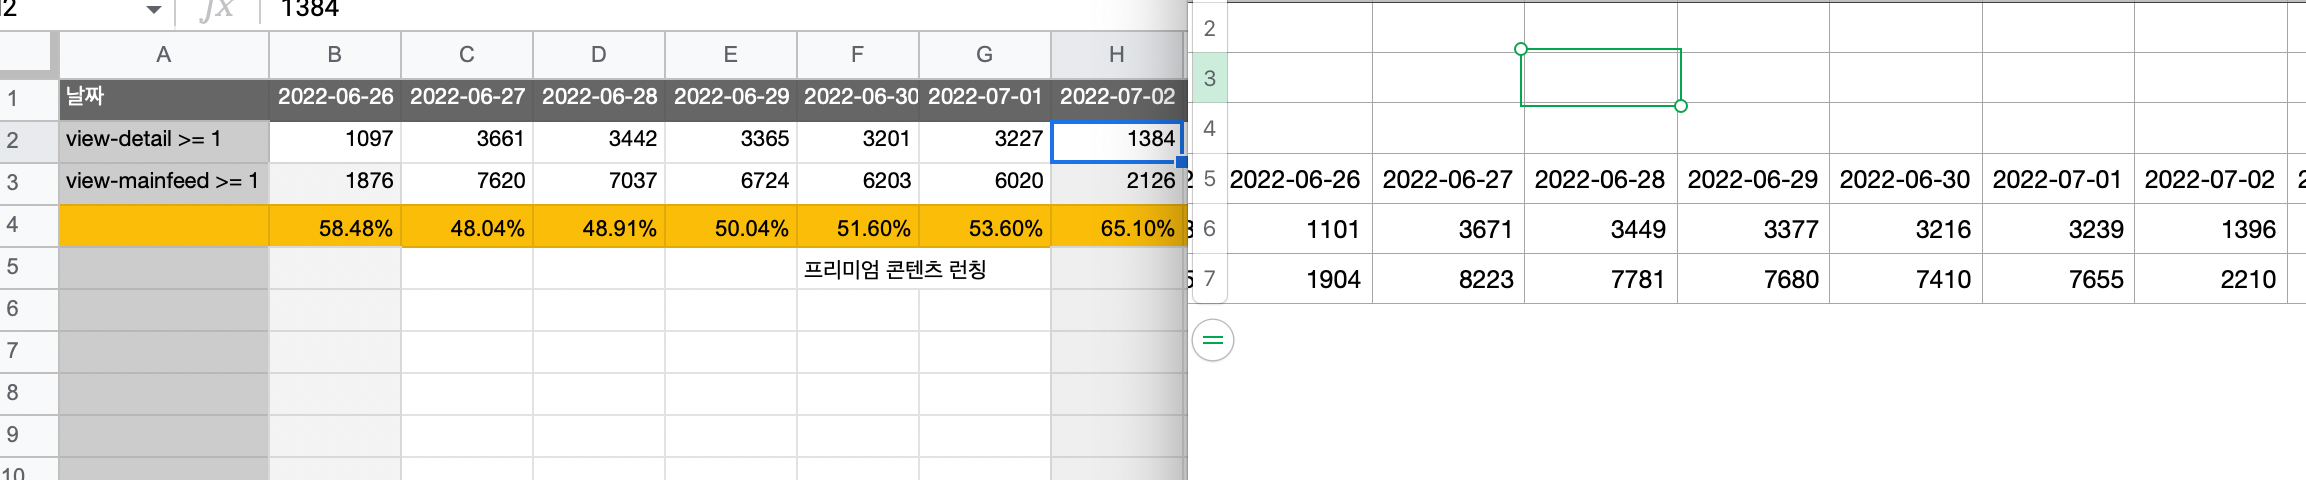
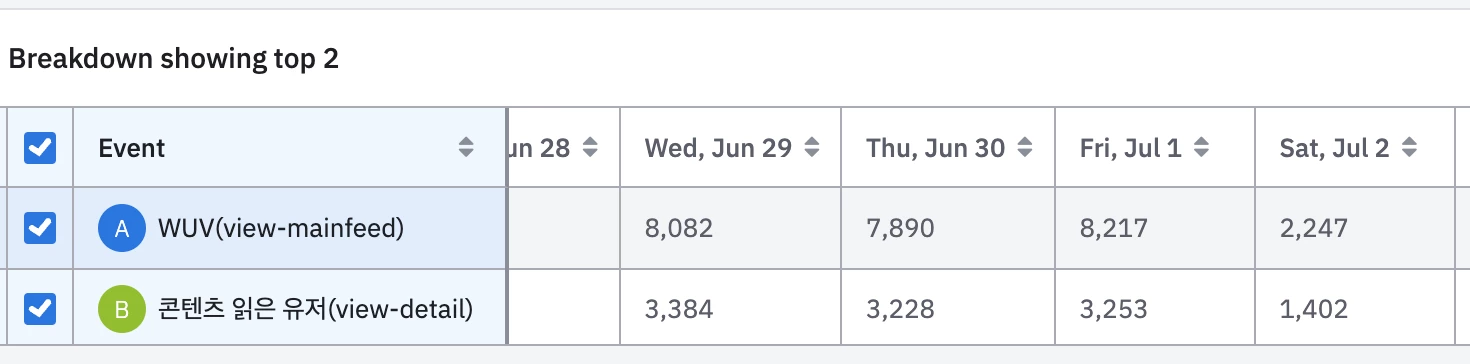
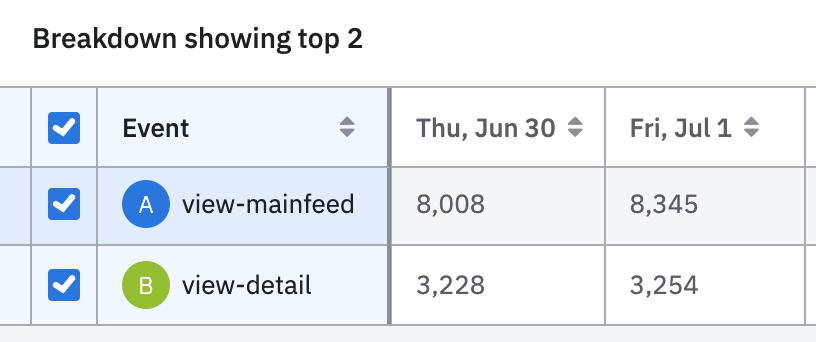
I counted the number of event_type of “view-mainfeed” in the entire event json, but it was less than the number in the chart
- event totals of chart : 9,458
- number of exported data: 9714
(maybe this isn't a big deal)
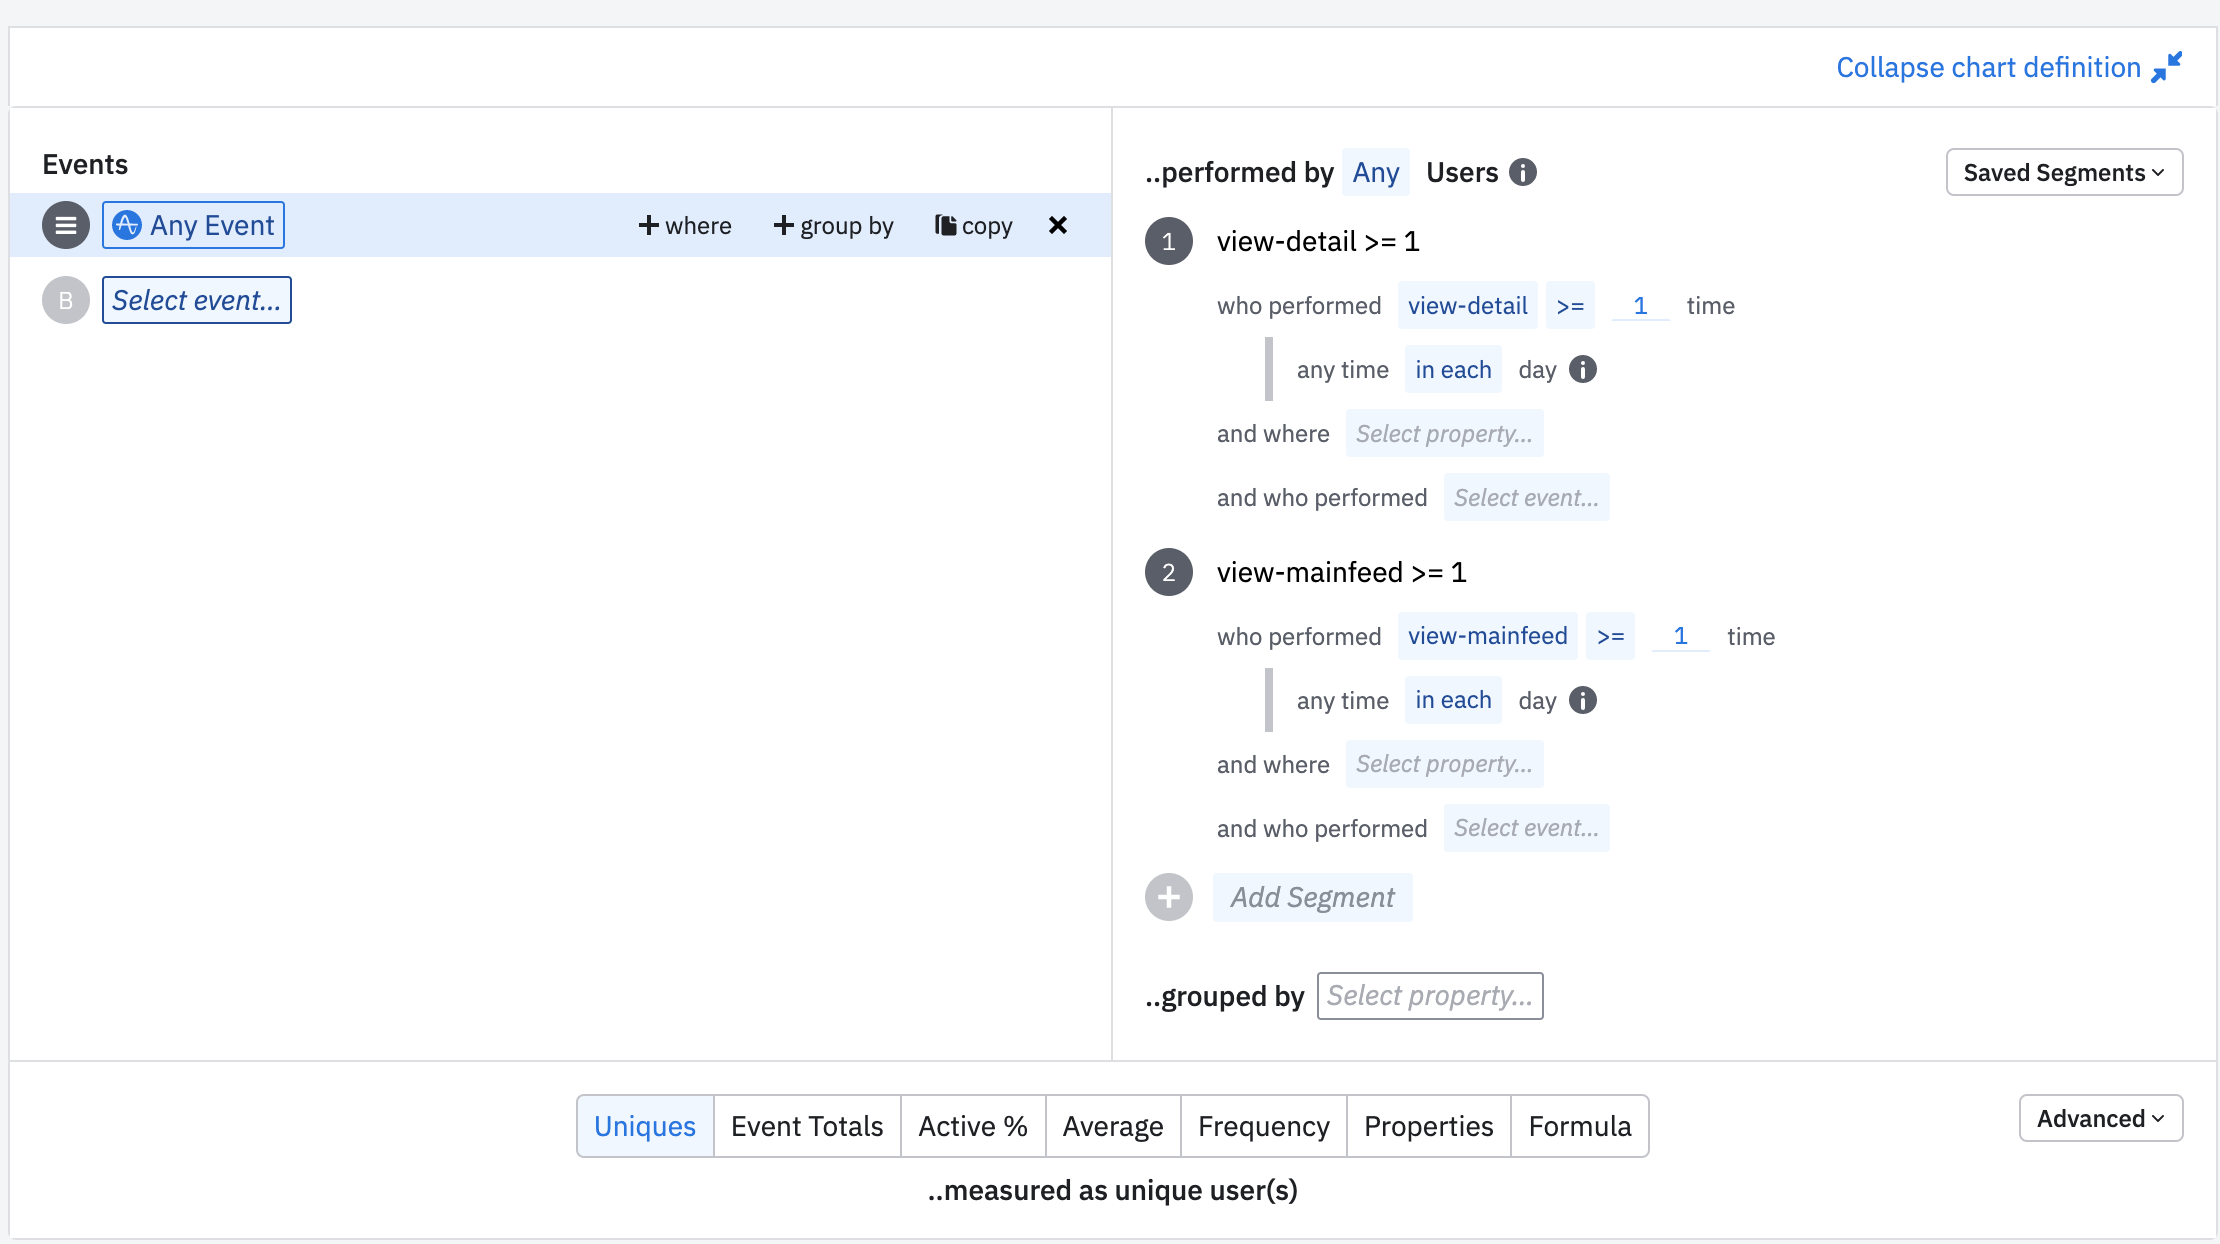
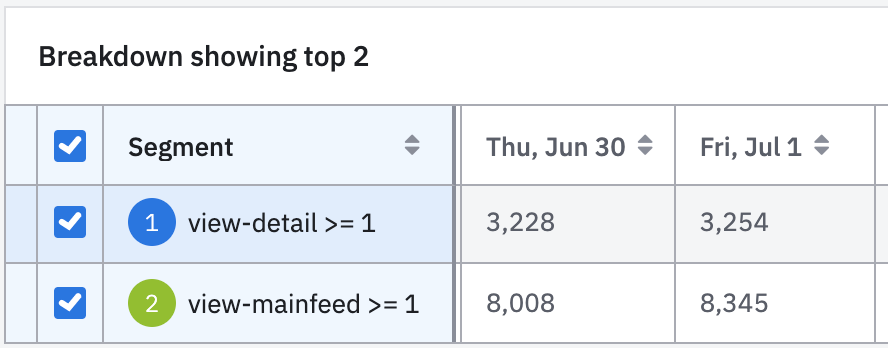
Q3. To see unique in the row data, I did unique based on the same `user_id` on json, but 4243 were found. The chart shows 8,008. Can you tell me what the "Uniques" criterion is?
Hi @Willy ,
With regards to question 1, you are looking unique users so they will be the same as the same unique users did the events you have chosen, as we see from the first chart. However, the first chart looks at ANY active event, while the other looks at those two specific events and only looks at the users who fired those events of view-mainfeed and view-detail. THese are active events so when you use Any Active Event, you will get the users who did those events and the users who did any other event that was considered active. Event totals looks at the amount of times an event was fired.
- Is event_time the standard for start and end of export api? For the Export API, you can refer to our article here. For the time parameter start and end, this is the first hour included in data series, formatted YYYYMMDDTHH. For example, '20220201T05 Would give 2022-02-01 from 05:00 in the morn. It is done by client event time. - When displaying by date in the chart, is event_time the standard as well? You cannot chose to display or group by event_time unless you implement a custom property for that yourself.
I counted the number of event_type of “view-mainfeed” in the entire event json, but it was less than the number in the chart Did you account for the timezone and the exact same time period as the chart? Then please show me the curl command you made and the chart you are referencing. The time is an important factor.
To see unique in the row data, I did unique based on the same `user_id` on json, but 4243 were found. The chart shows 8,008. Can you tell me what the "Uniques" criterion is?
Sorry Willy, I don’t understand what you mean here. Which User ID? Can you show me the chart where you saw this? Are you accounting for timezones? Thanks
Hi @Denis Holmes
Thanks, I was able to find the cause of the problem.
We compared the difference between client_event_time and server_received_time in raw data. In fact, there were cases where there was a difference of more than two weeks. So I've actually found that the user closes the app and comes back too late.
ps.
I found that to bind the data to a user-unique, use amplitude_id .
If you don't have an Amplitude account, you can create an Amplitude Starter account for free and enjoy direct access to the Community via SSO. Create an Amplitude account. You can also create a Guest account below!
If you're a current customer, select the domain you use to sign in with Amplitude.
If you don't have an Amplitude account, you can create an Amplitude Starter account for free and enjoy direct access to the Community via SSO. Create an Amplitude account. Want to sign up as a guest? Create a Community account.
If you're a current customer, select the domain you use to sign in with Amplitude.