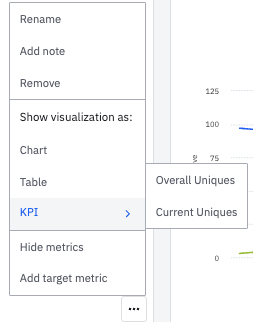
I have been creating singular text boxes in Looker Studio using BQ data. This data is updated live with the BQ data and has specific date ranges set on it, for eg: last week or last to last week date range.
I want to know how can I create such single data point text boxes with defined time ranges - which will give me a visibility on what my static metric is for any period of time.
I will use this to create a dashboard for my team where they can see how any metric has been performing for different periods. Graphs for this type of analysis with multiple data points become too cluttered.


