I’m surprised I couldn’t find quite a basic function of creating a histogram for my events by the time they fired during the day - even hourly bins would be extremely helpful. Did I miss something, or it is impossible to create such chart yet?
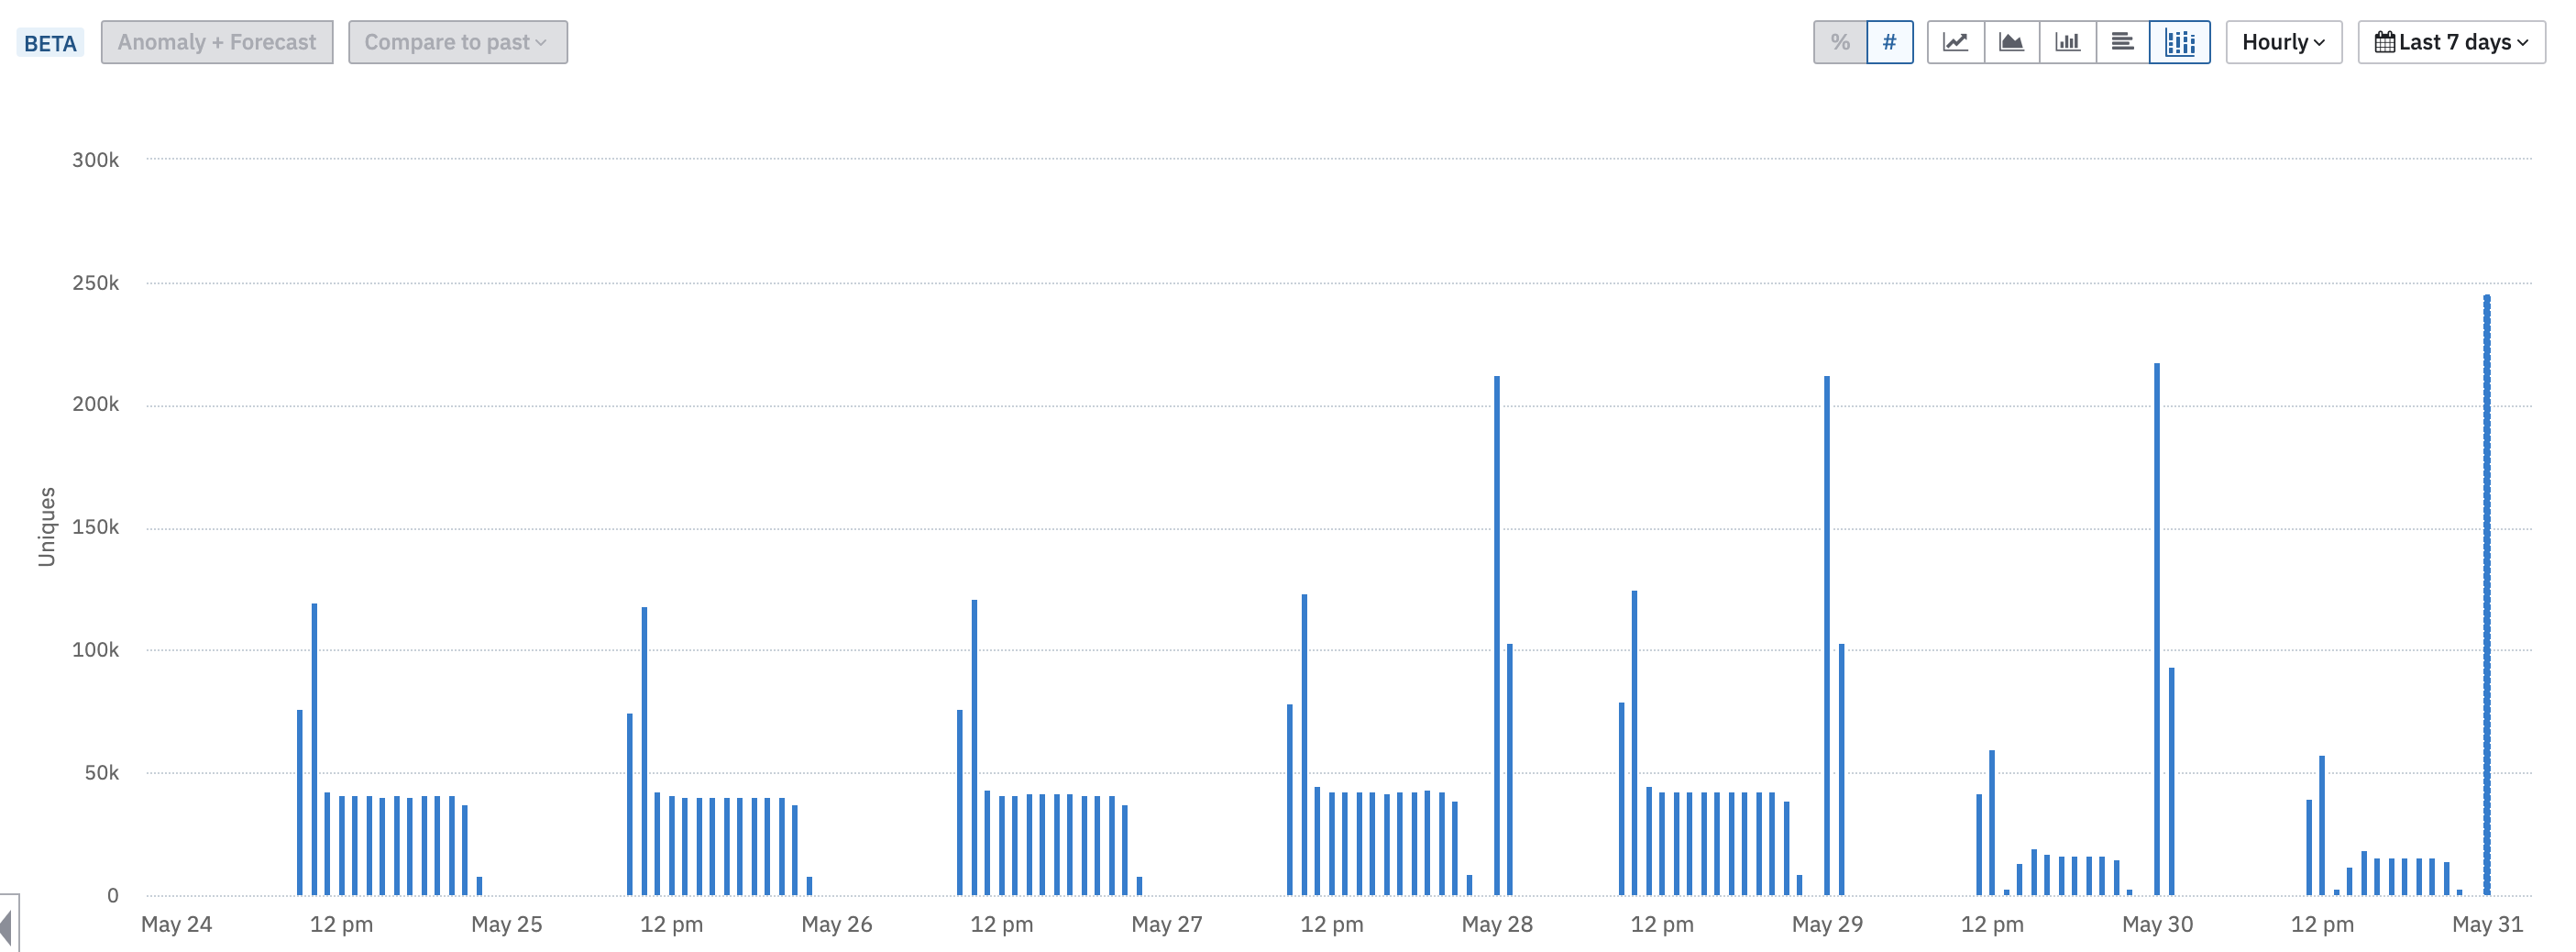
Hey silver_surfer! We have a hourly interval in the time-picker, and you can visualise the data in a stacked bar chart format. The result will look like this:
ning.chang! That’s certainly better than nothing. However, ideally, when I look at longer timeframes than a few days, I would rather see these histograms-per-day averaged out into a single histogram with averages per hourly interval. So I look at one chart instead of 30 mini-charts, if you know what I mean
Hey silver_surfer ,Referencing a similar question which was asked before.
Hoping this might provide some additional help.
Our dev just deployed amplitude to our portal. When I look at the website payload in my browser debug I can see the amplitude api key. I am trying to understand if this is by design or if there is way to hide this.
Hey there I've been playing around for a couple of hours with the guide and analytics which fires properly on the UI but wouldn't give me any analytics. I read that there is another script that should be installed for the analytics part of things. Would anyone be able to guide me towards the potential script or some…
All my data is being collected through Firebase I want to export all this data in Amplitude and keep it synced with GA4, I tried adding data sources as BigQuery and GA4 both but for some reason it only partially imported the data and now its not working, I cant even see connected sources. Any help will be appreciated.
How do I transfer data from one amplitude account to another? It seems all the community chats about this have completely broken links. Easy to export, no way to import, very frustrating. :(
When using @amplitude/plugin-web-vitals-browser with Create React App v4 (react-scripts@4.0.3), the build fails with: ./node_modules/@amplitude/plugin-web-vitals-browser/node_modules/web-vitals/dist/web-vitals.js<br /><br />SyntaxError:…