
Did you know?
You have the power to turn qualitative feedback data into a quantitative output in Amplitude. All you need to do is build a derived property to transform the text into a number.
We collect some sentiment data via Intercom and tag those responses as ridiculously long strings. "survey responded - program name - channel - question name - response value - survey id" . Through the Intercom < Amplitude integration, this data gets ingested as an event property. Sure you can use glob match conditions to parse out the response values, but you can’t perform calculations on strings.
By building a derived property in reference to this event property, we are able to
-
extract portions of the string response values, such as “moderate” or “very satisfied”
-
and transform these values into meaningful integers, such as a score of “3” or “5”, respectively, in a 1-5pt scale
This enables us to perform calculations on the data such as AVG sentiment score, and then furthermore break that score down by region, plan, or assigned CSM, etc.
Configure the derived property
 Below is the logic we used for this specific derived property setup.
How to interpret this logic:
- inspect the event property values from `tag.name`
- sample value:
survey responded - DCI1.1 post - chart comfort: easy - sid:4bceb7ed9e0927d9
- sample value:
- extract everything after
:Note: we included a space after the colon- 1 indicates accept all values to the right
- stop extracting the value when it reaches
-Note: we included a space before the dash- 0 indicates accept all values to the left
- this leaves us with the extracted string easy from the sample value above
- then transform the extracted string into a number
- e.g. transform the string ‘easy’ to 4, in a 1-5pt scale
- finally, set a new property name for this derived property, such as `tag.value`
SWITCH(

    SPLIT(

        SPLIT(

            tag.name ,

            ': ',

            1

        ),

        ' -',

        0

    ),

    'very difficult',

    1,

    'difficult',

    2,

    'meh',

    3,

    'easy',

    4,

    'very easy',

    5,

    'very unsatisfied',

    1,

    'unsatisfied',

    2,

    'moderate',

    3,

    'satisfied',

    4,

    'very satisfied',

    5

)
Apply the derived property in your analyses
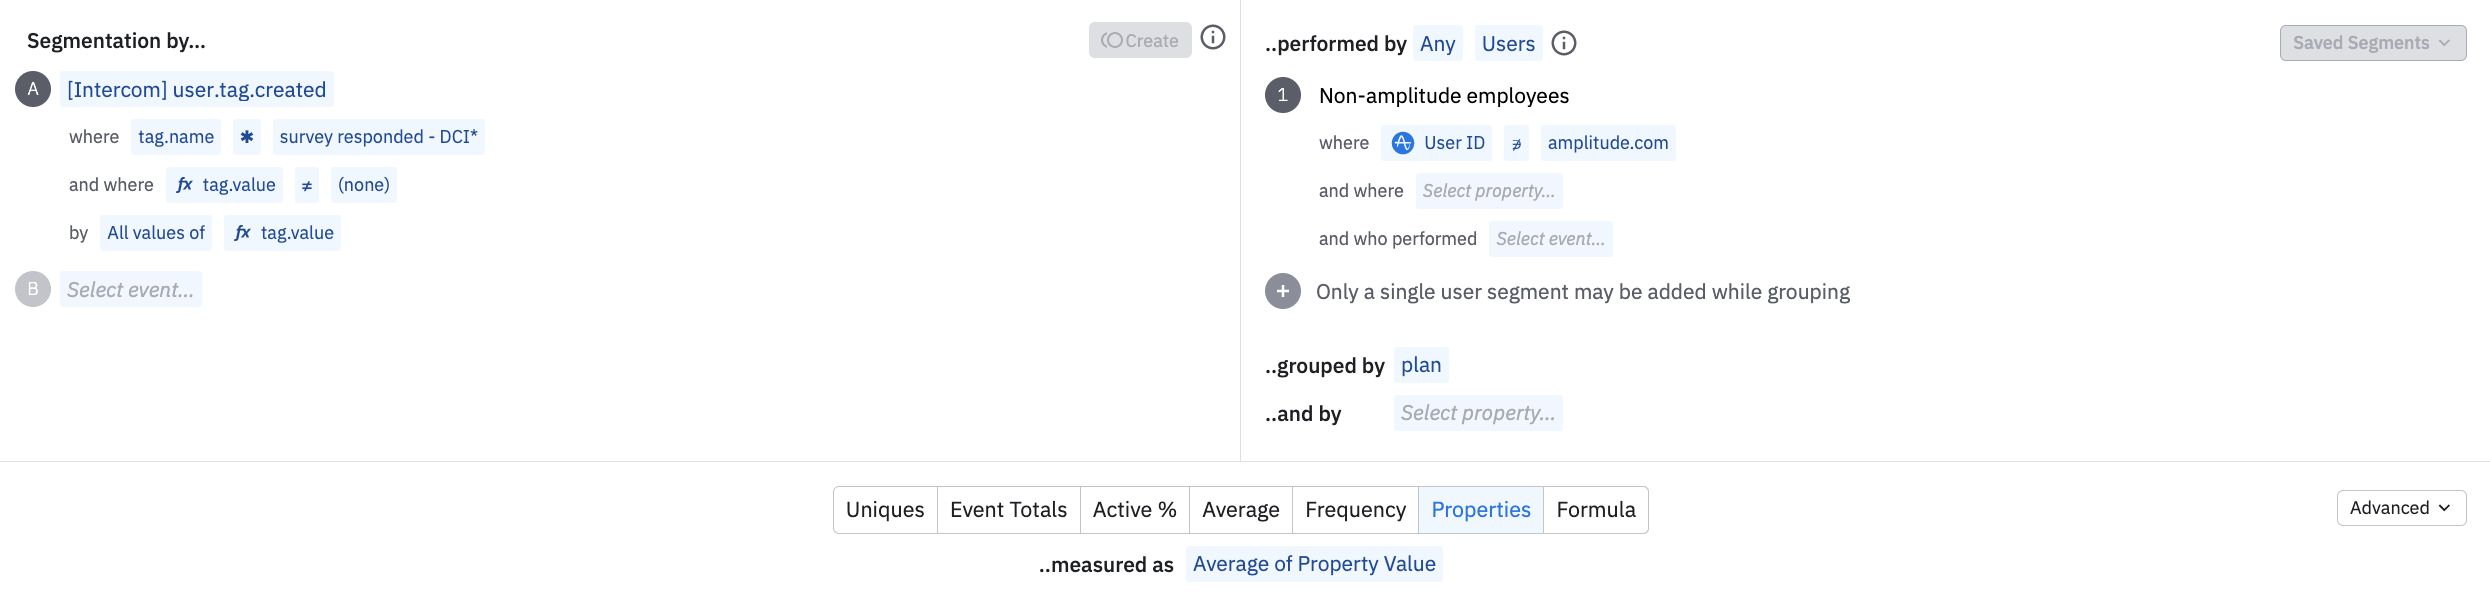
 Once you configure this new derived property, you can set up a simple query in an event segmentation chart to calculate the AVG sentiment score from your survey responses, broken out by the customer plan type.
Q: Are users who spend more $ actually happier on AVG in your product compared to users on a freemium or trial plan?
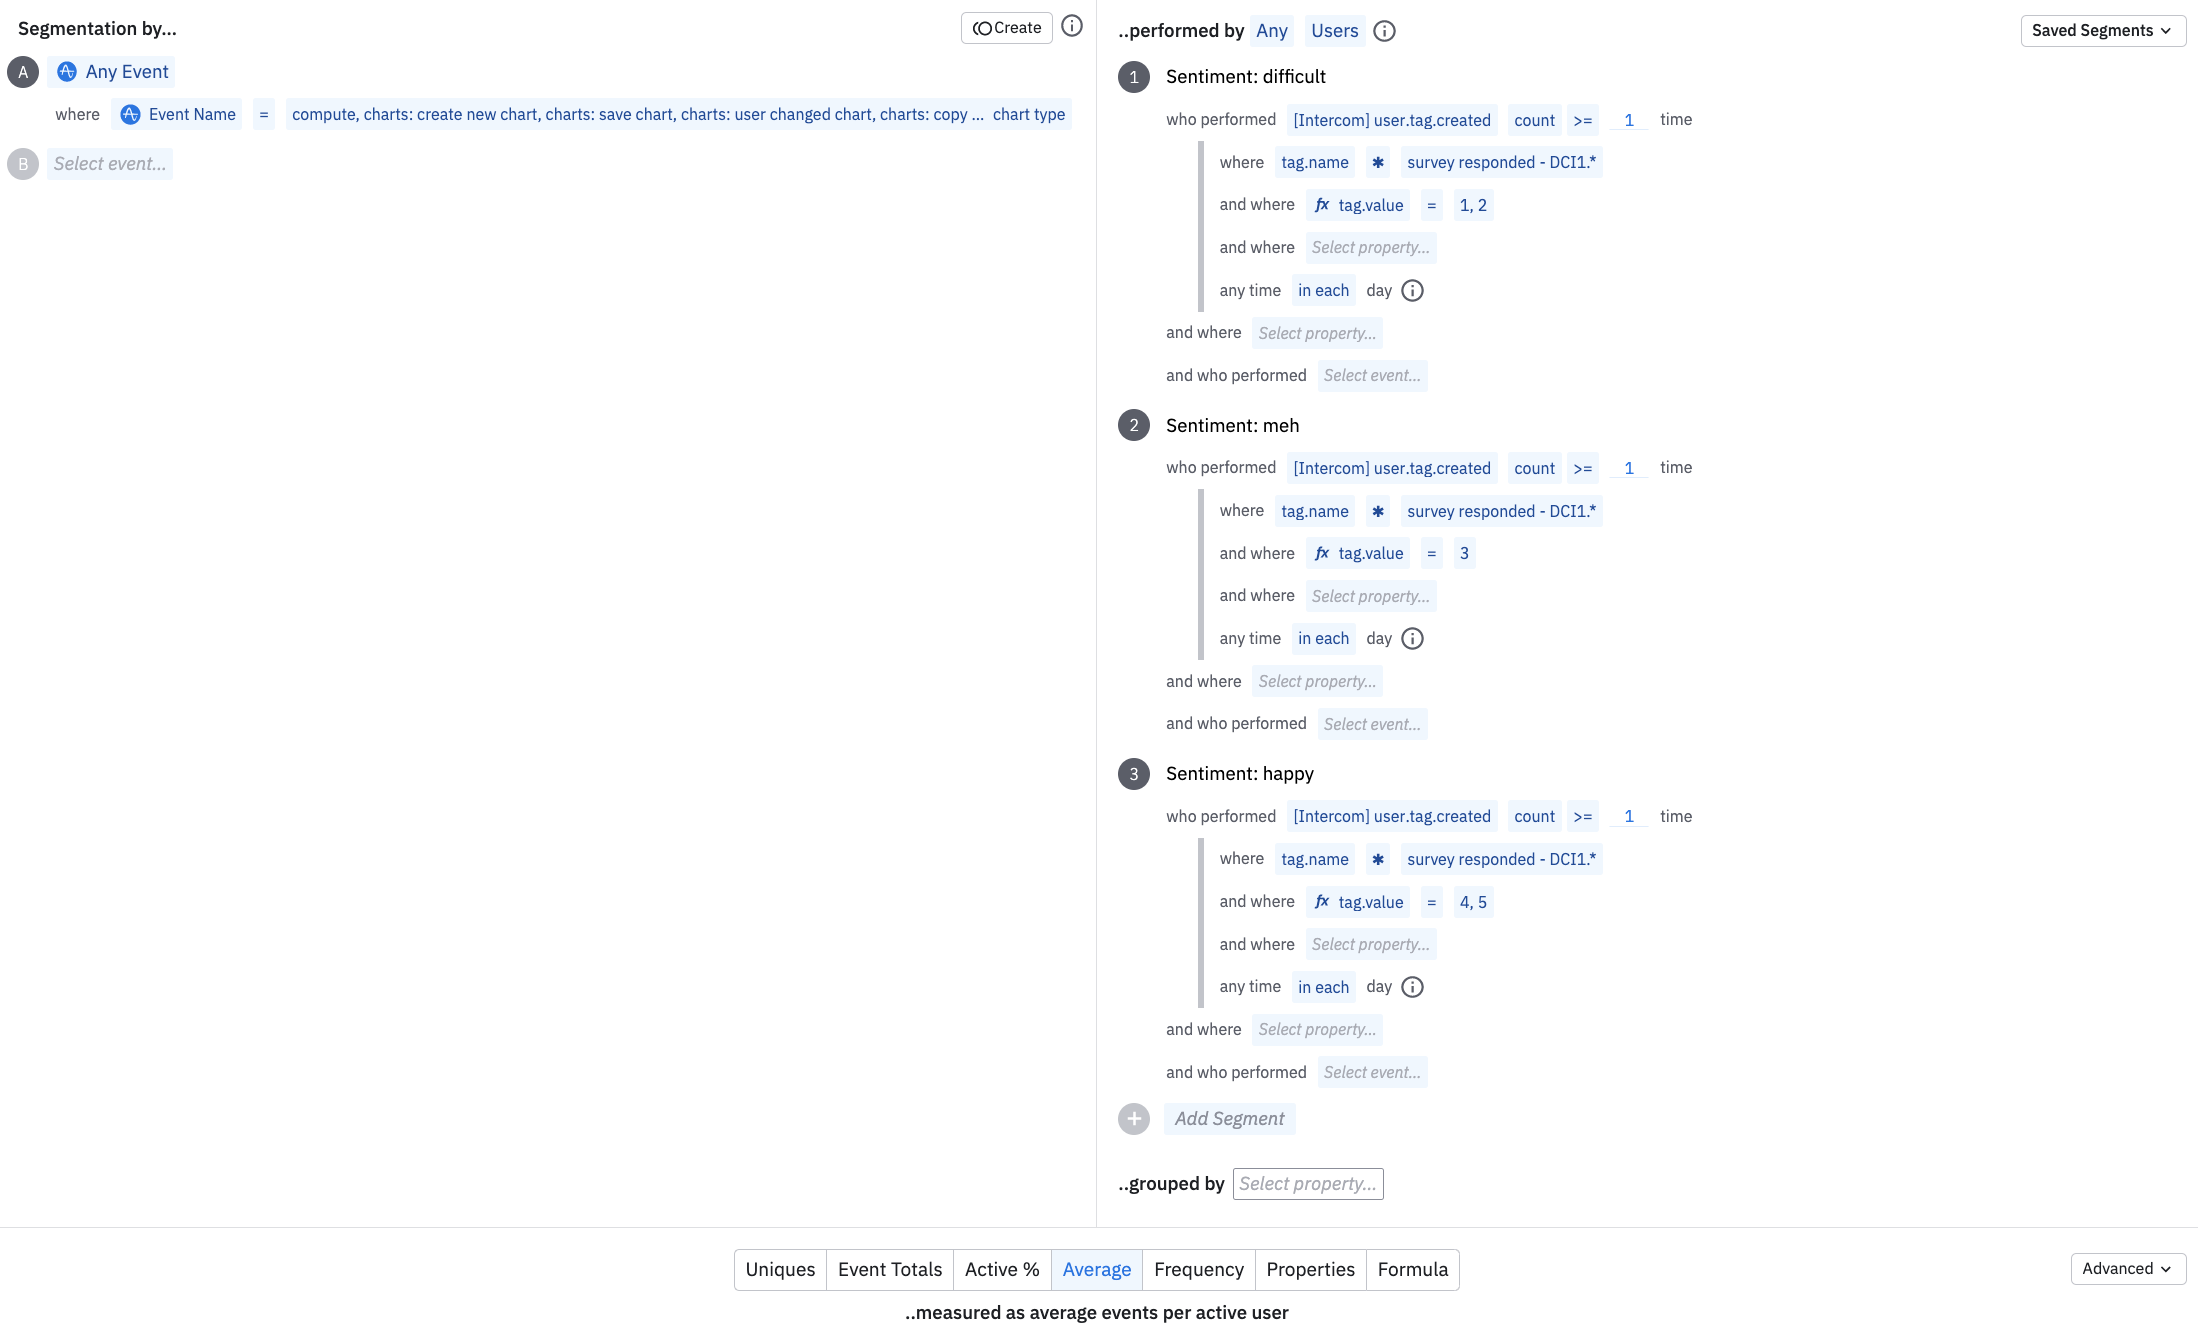
You can also analyze sentiment data alongside product usage data. Consider building 3 user segments in an event segmentation chart.
- Segment 1: negative sentiment responses
- Segment 2: moderate sentiment responses
- Segment 3: positive sentiment responses
Then select some critical actions that indicate valuable or meaningful product usage.
Q: Are users who responded with a negative sentiment still actively using the product? On AVG are they one of the most active segments? Perhaps they are more advanced users who complain more because they have higher expectations for the product.
Don’t forget to inspect Event Totals too, in case a few outliers are inflating the AVG event counts.
Comment below if you have any questions.

