Hi! I have a small question - may be it very simple, but i don't find any answers.

I am trying to create a simple graph - the number of users who have installed the app.

I am using the “New User” metric for this - “A new user is a user who has logged an event for the first time”.

When i use “Uniques(New User)” I receive correct results, but if I use “Totals(New Users)” - the final value is increased by ~ 9 times (167->1494) in the same period.

According to the documentation, the "new user" event should be registered 1 time and it seems to me that the Total and Uniq in this case should not differ?

I plan to use these metrics for further calculations and I need to understand the logic - please help)
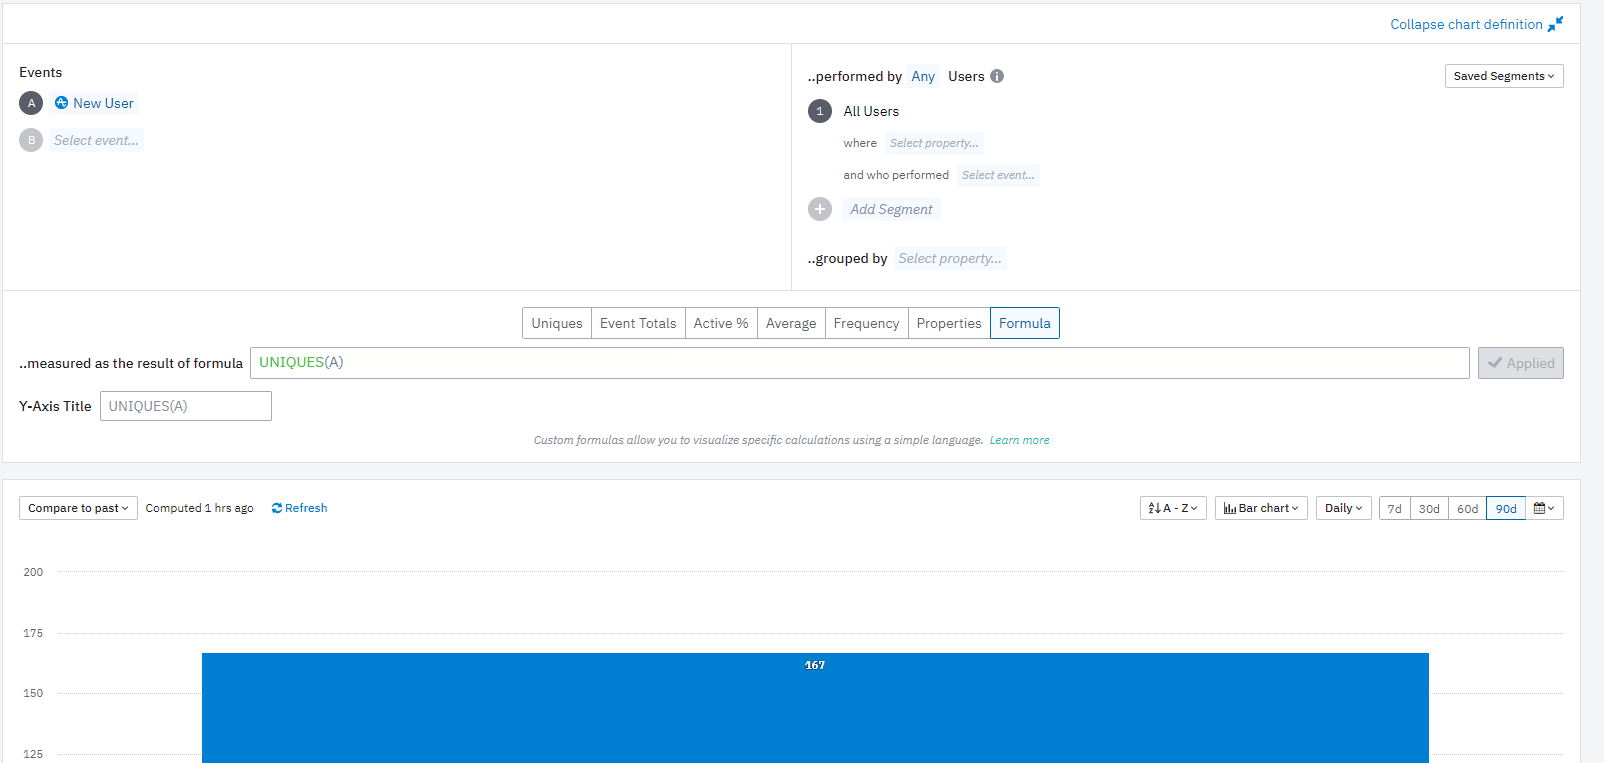
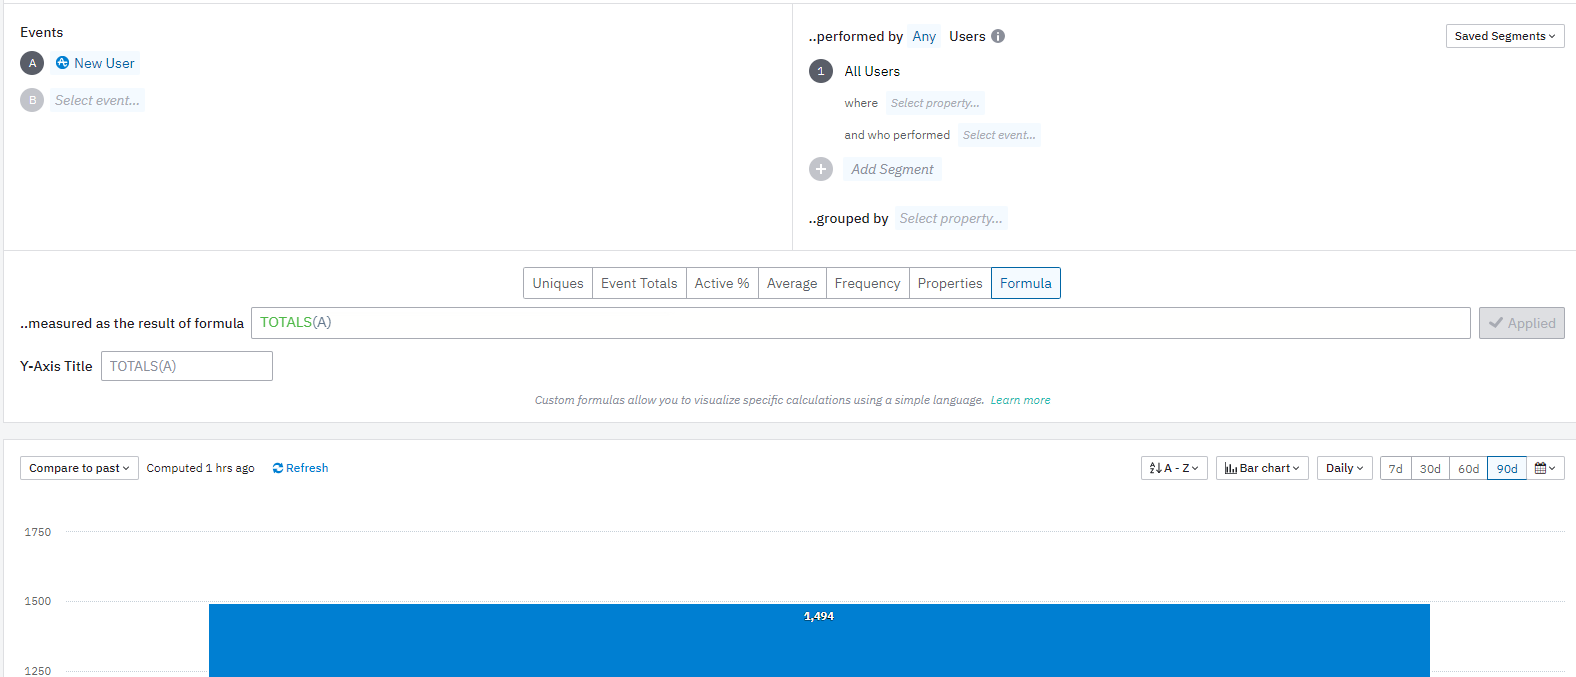


This is because strictly speaking “New User” is not an event, even though the UI implies it is. Essentially it just gives MIN(event_time) value for each user.

This means it's only meant to be used with Uniques or in cohort definitions. If you use Totals, you get the total number of all events generated by the users who were new during the chosen time period instead. So essentially Totals being ~9 times as large as Uniques tells you that on average, your new users perform ~9 events during the chosen time interval.

I agree that this isn’t necessarily the most intuitive thing, but best to stick with Uniques when analysing your new users.

As a sidenote: there is no need to create custom formulas for Uniques or Totals, that’s what the pre-defined buttons are there for.

Thanks for your answer, I used formulas for clarity.

I realized that I needed to use “Unique()” to get the result I needed. But your explanations regarding the total number of events are not entirely clear - I counted all registered events(not standard, but only those that I pass from the app) - there are more than 2500 of them for the selected period and all of them, following the logic, were generated by New Users...


Hi Sergey!


@MikkoKarvonen  is correct! New User: Queries on new users over the time period selected. For example, if you wanted to view the daily new users, you would select New User and change the measurement in the bottom module to Uniques. A user is considered to be "new" the moment they send their first event to Amplitude. When ' Amplitude] New User' is used in a chart, the chart will consider all events that were performed by the New User during the interval (day/week/month) that they are new. For example, in an Event Segmentation chart, if you compare "Uniques" vs "Event Totals", you may see a higher count of events than the number of new users.

However, if you see inconsistencies as you mentioned, would you be so kind as to send me the link to your chart you see the inconsistencies in? I can then investigate further for you, thank you!


I was wondering about this same question. Thanks for the response! Makes sense. 


Reply