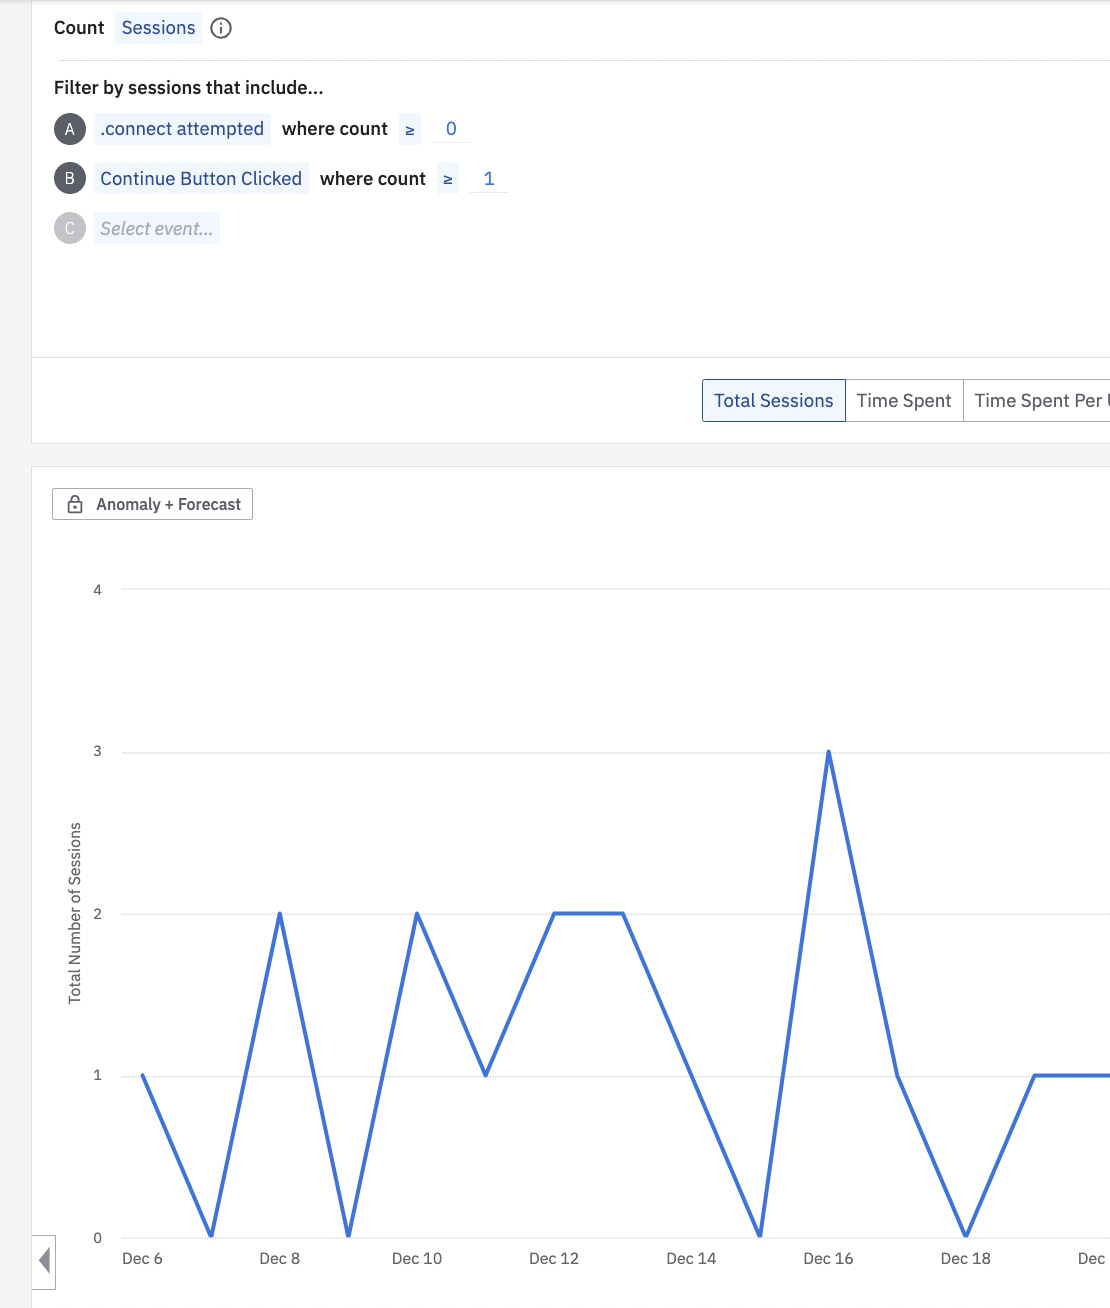
Our product has two events, one to represent the start of an online experience - “connect” - and one to represent the first step in continuing down that experience “continue”.
I am trying to visualize the daily number of users that connect, let’s say 100 today, and the percentage of those that continue, let’s say it ranges from 20-40 depending on some factors.
How do I do that with our current view? It continues to appear as a single line.
