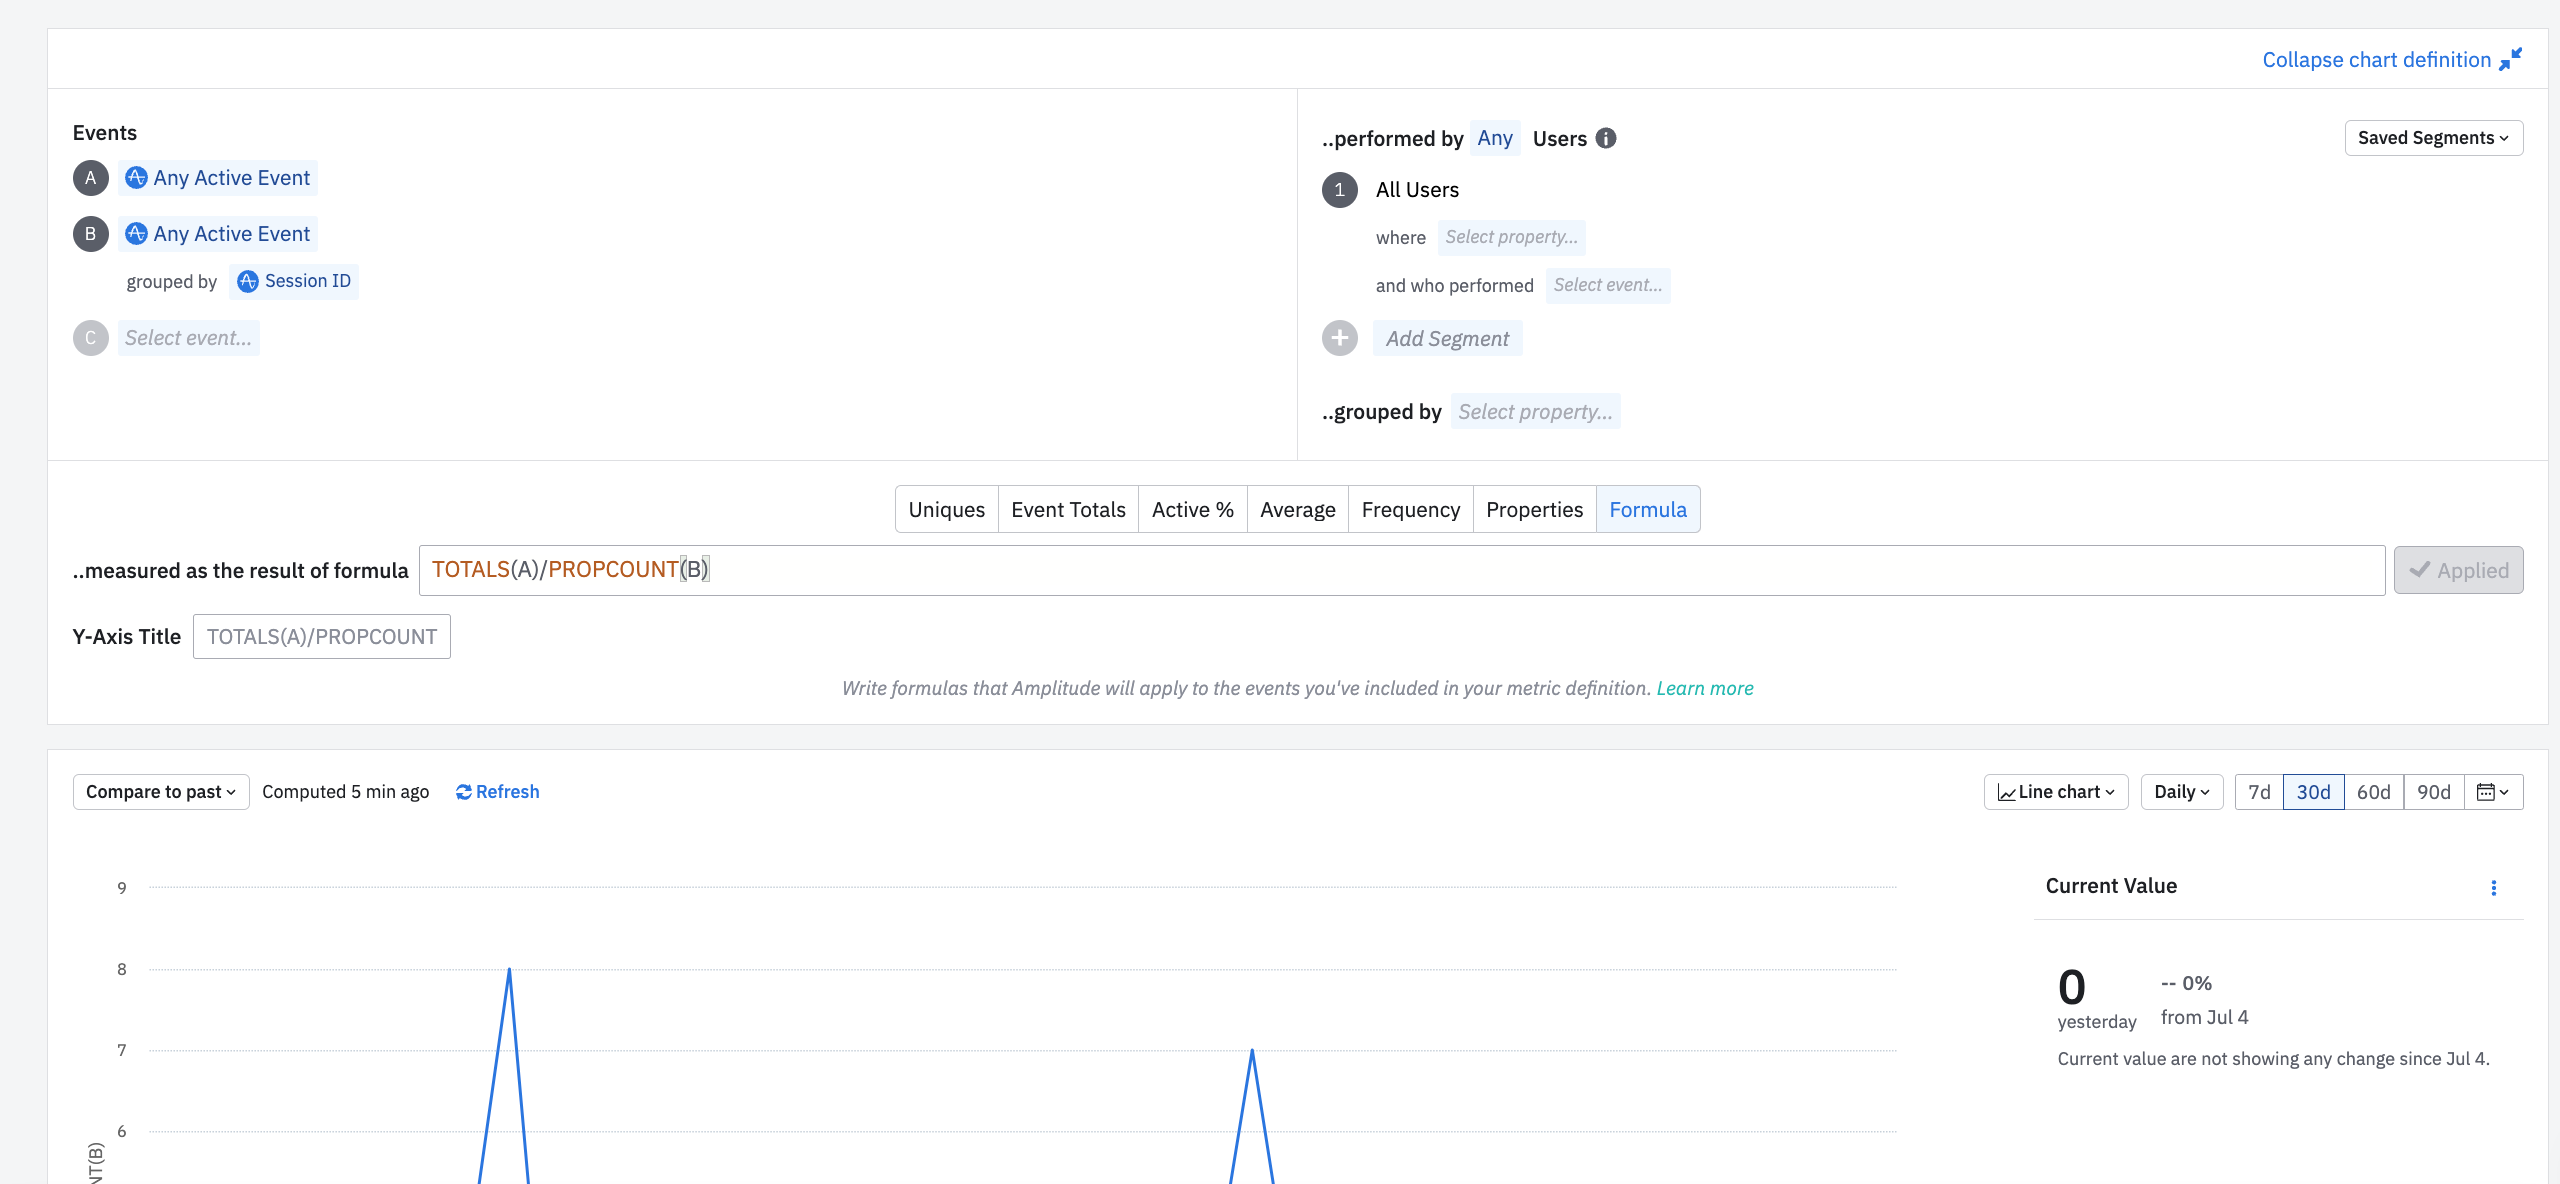
how to measure How many unique events triggered through in a single given session
Hi  Thanks for reaching out here. I found this article in our Help Center that might help. Please let us know if there’s anything else that you need!
i want to track all events triggered through single session while example on academy covers events triggered between particular date.
now how do i get this.
Hey there
However, you could try and use custom formulas.
I've created an example chart here where we're looking at total active events/total session ids:

You can check how our Custom formulas work here.
We also do have a metric called Distinct Property values per User in Event Segmentation chart which graphs how many different property values each user triggered on average, e.g. the total sum of unique user-distinct property value pairs divided by the number of users. Not sure if this is what you're looking for exactly but we also have a few other metrics on the property value too - see https://amplitude.zendesk.com/hc/en-us/articles/230290208#metrics-bottom-module.
So grouping by the property like Session ID might be another option.
best,
Zhenia
Thanks a lot.
Hey
I haven’t used this feature personally, but you can also try using the User Sessions chart on the Count by “Events performed within sessions” clause. eg.https://analytics.amplitude.com/demo/chart/new/fegloqp
You can read more on this feature in here.
Hope this helps.
Reply
Welcome to the Amplitude Community!
If you don't have an Amplitude account, you can create an Amplitude Starter account for free and enjoy direct access to the Community via SSO. Create an Amplitude account. You can also create a Guest account below!
If you're a current customer, select the domain you use to sign in with Amplitude.
analytics.amplitude.com analytics.eu.amplitude.comWelcome to the Amplitude Community!
If you don't have an Amplitude account, you can create an Amplitude Starter account for free and enjoy direct access to the Community via SSO. Create an Amplitude account. Want to sign up as a guest? Create a Community account.
If you're a current customer, select the domain you use to sign in with Amplitude.
analytics.amplitude.com analytics.eu.amplitude.comEnter your E-mail address. We'll send you an e-mail with instructions to reset your password.


