Solved

How do I pull a specific event (with all event properties) and export to CSV?

  • 20 September 2021
  • 12 replies
  • 1672 views

Userlevel 1
Badge +2

Hello!

I am new to Amplitude, and I am attempting to integrate Amplitude with my VR app. At the conclusion of the VR experience, data about the user’s experience is compiled into an event with about 30 or so event properties (each event property is a datapoint generated by the user’s experience).

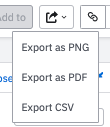
For the date range of my choice, I need to compile and export (as a CSV) all instances of this specific event, along with all event properties, so that I can analyze aggregate results from the VR experience in Excel.

How can I accomplish this?

icon

Best answer by Saish Redkar 20 September 2021, 19:39

View original

12 replies

Userlevel 7
Badge +10

Hey @REM5 Studios ,
Welcome to the Amplitude Community!

If you are looking at exporting specific raw events from charts, then this isn’t currently possible in Amplitude.  

You can however export the chart results, especially for event segmentation charts in a CSV format depending on what you are looking for using the “Export CSV” option.


To export all your events and its event properties ingested in your project, you can export them via the Export API or do a quick export using the “Export Data” option in your project settings.

Here is a similar answered question for added reference - 

Hope this helps!

Userlevel 1
Badge +2

Hello @Saish Redkar. Thank you for your reply.

I used the “Export Data” option in my project settings as you mentioned. For a date range of a few days, the export I downloaded contains multiple files in JSON format (which I had to unzip from .gz).

When I try to import one of the JSON files into Excel (via Data > Get Data > From File > From JSON), I get the following error:


To confirm there is an issue with the JSON format, I opened the JSON file in a web browser (Firefox) and get the following error:


I get the same results for all of the JSON files that were downloaded in the export. When I open the file in a text editor, I see that there is data in there.

What is the proper method to import the JSON files into Excel?


EDIT:

Here are results when I run one of the JSON files through an online validator (https://jsonformatter.curiousconcept.com):


Does this mean that Amplitude needs to fix the Export API for the JSON files to be usable?

Userlevel 1
Badge +2

Also, assuming the above issue can be fixed, I have another question:

The exported data is split up into many separate JSON files. This means that each file has to be manually selected and imported. Is there any less-tedious method that is recommended to import all of the exported data at once into Excel?

Userlevel 7
Badge +10

Hey @REM5 Studios ,

The results of the Export API are returned as a zipped archive of JSON files, one or multiple files per hour. Each day’s worth of data is essentially split into 24 files, each file having lines of raw events in the json format for a given hour of data. For large scale analysis, I would recommend something like Python Pandas or Spark to process these files instead of Excel. 

Most of your event analysis could be performed using the Event Segmentation Chart  in Amplitude itself. Is there a specific reason you want to utilize Excel to analyze this?

Userlevel 5
Badge +3

I agree with @Saish Redkar. Using Excel to analyse your results sounds like a convoluted approach, unless you have a very specific reason to do so. Is there a reason why you couldn’t do your analysis in Amplitude? If so, something that is able to handle batch loading and processing a large set of JSON files would be much easier than Excel. Python and Spark both work, as would R Studio.

As for the JSON format, it seems that there is something weird about the Export API output currently. We’ve been using it before without issues, but when I tested it now, I’m seeing similar results you are. We’d need Amplitude representative comment on that one, @ning.chang.

Userlevel 1
Badge +2

@Saish RedkarThank you for the information and recommendations! And @MikkoKarvonen thank you as well! I appreciate it very much.


The reason that we are using Excel for analysis is because we are a small studio and Excel is what we are already familiar with. For our goals, it is adequate. None of us are familiar with Python Pandas, Spark, or R Studio (although I am certainly willing to look into these options). I am also just getting the hang of Amplitude.

I’m positive the methods you mention are better, however my first order of business was collecting and analyzing the data I need, so I ended up writing a custom tool in C# via Unity to process and convert the exported Amplitude .json files into a single file that can be imported into Excel. So I should be alright as far as that goes.

That being said, I want to look into the other software that has been mentioned and I would like to learn how to do my analysis within Amplitude if possible.


So then, if I were to do my analysis within Amplitude, I have some questions:

  1. What is the best way to see the number of occurrences of a specific event (for all users) in a specified date range?
  2. What is the best way to see the number of occurrences of a specific event property value within an event (for all users) in a specified date range?

Can the Event Segmentation Chart accomplish the above, and is this the best way to do this?


Thank you for your patience helping out a new Amplitude user! :)


Userlevel 7
Badge +10

Hey @REM5 Studios ,

Thanks for the added context.

Event analytics is one of the core and powerful capabilities of Amplitude as an analytics platform. 

I would recommend reading the following help articles for understanding the event segmentation charts:

To answer your questions, here are some demo event segmentation charts which you can refer to get started with your analysis-

  1. A demo chart showing a specific event’s count in a give date range 
  2. A demo chart showing the grouping by of a specific event property

Hope this helps! Happy to answer any additional questions to help you get started.

Userlevel 1
Badge +2

@Saish Redkar I will look into this!

Thank you!

Userlevel 1
Badge +2

@Saish Redkar The information you provided was very helpful!

I have another question: What is the best way to determine the average time duration between specific events?

For example, I’d like to determine how much time, on average, users are spending reading a specific UI dialog box. I have an event for when they are first shown this dialog, and a second event for when they are finished with the dialog.

Or, I’d like to determine how long, on average, it takes users to complete one full game loop.

Since there is an event time attached to each event, is there a good way in Amplitude to measure and display the average time between events?

Userlevel 7
Badge +10

Hey @REM5 Studios 

The Funnel Analysis chart can help you with this.


Userlevel 1
Badge +2

@Saish Redkar I will look into that, thank you!

Userlevel 5
Badge +3

Funnel chart will help you in most situations, but if understanding the duration of a full game loop, for example, is a key metric for you, I’d also consider creating an event specifically for tracking it. It will give you more options to analyse the data.

Basically, if it feels like the current Amplitude charts don’t match your needs with your current set of events, fix your data so that you get the answers you need.

Reply