Question

Help understanding the Breakdown Table for Retention Analysis

  • 6 September 2024
  • 7 replies
  • 27 views

Hi everyone :)

I’ve been researching Amplitude’s community and I’ve read, re-read, asked ChatGPT Claude, Gemini to better understand my breakdown table. But I don’t seem to get it.


I want to calculate the retention rate of my users from the month of march.

  • I’ve selected the dates March 1st to March 31st.
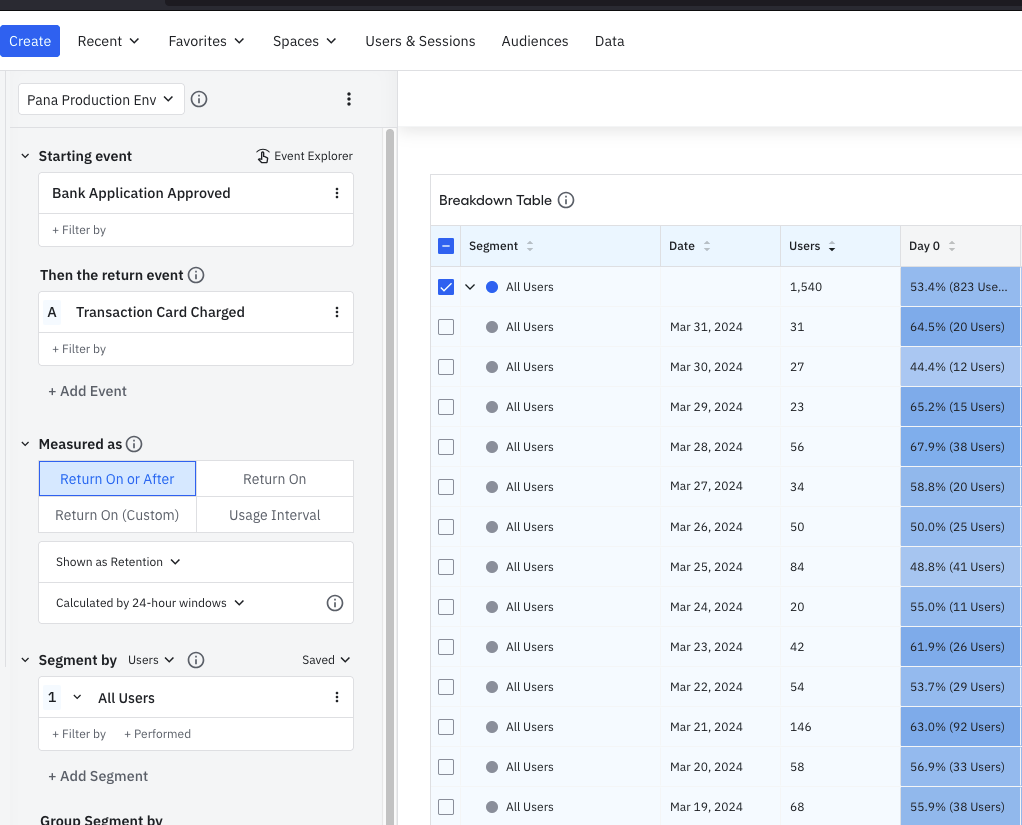
  • The starting event is “Bank Application Approved”
  • The return event is “Transaction Card Charged”

Meaning:

  • If the user opened a new bank account, I want to see when it used his card.

But some numbers don’t add up.


Given the following 2 screenshots:

……

Continuing with the beginning of the month


(If I interpret the chart correctly).

  1. Each row of the Users column give me the number of users who triggered “Bank Application Approved” on that day.
  2. Day 0 gives me the number of users of that given row, that triggered the “Transaction Card Charged”.
  3. Day 1, Day 2, Day 3 are NOT calendar days, but rolling-days that move every 24 hours.

E.g:

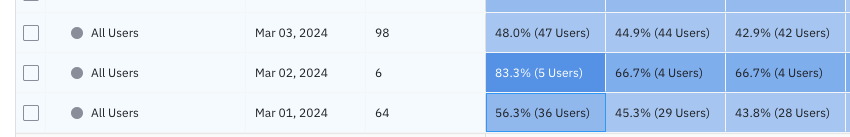
March 1st, 64 users had their bank application approved, and on that same day 36 out of the 64 transacted with their card.


If from my reasoning above, #2 and #3 are correct, then why is it that when I go and check for those events individually in the segmentation graph, and then download the users, I don’t have the right count?

Let me explain.


I decided to corroborate the data, as these return values seem exceedingly high.

I went ahead and created a separate segmentation chart (shown below)


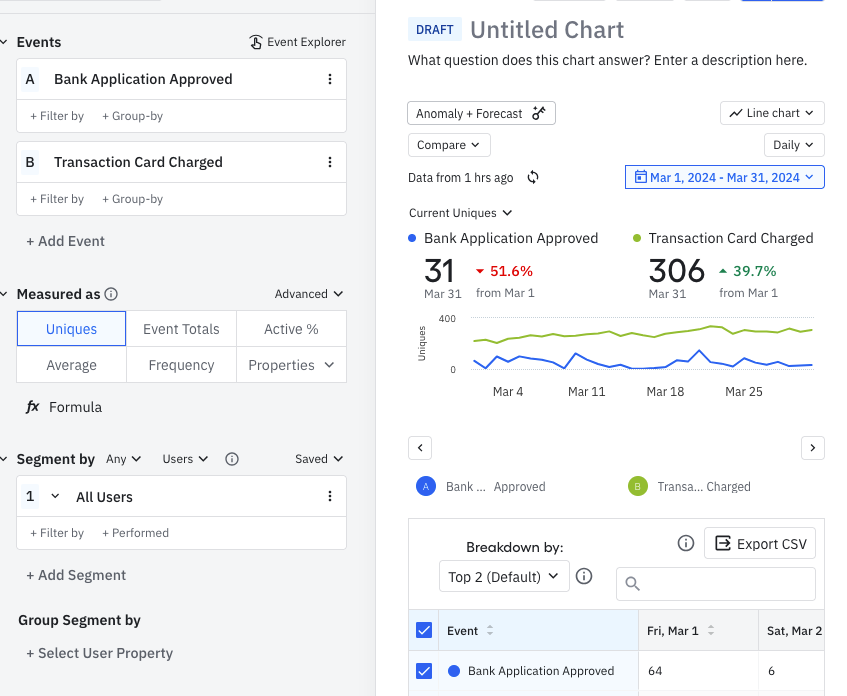
With this segmentation chart I hovered my mouse over March 1st (Day 0) for Bank Application Approved and Transaction Card Charged.


The Bank Application gives me the 64 that shows correctly on the Breakdown Table. But The Transaction Card shows me 219 (Which is to be expected as not only people who opened the Bank Application would use the card).


That means, that I have to remove those from 219 who aren’t part of the original 64 to give me the 36 count, right?


For that:

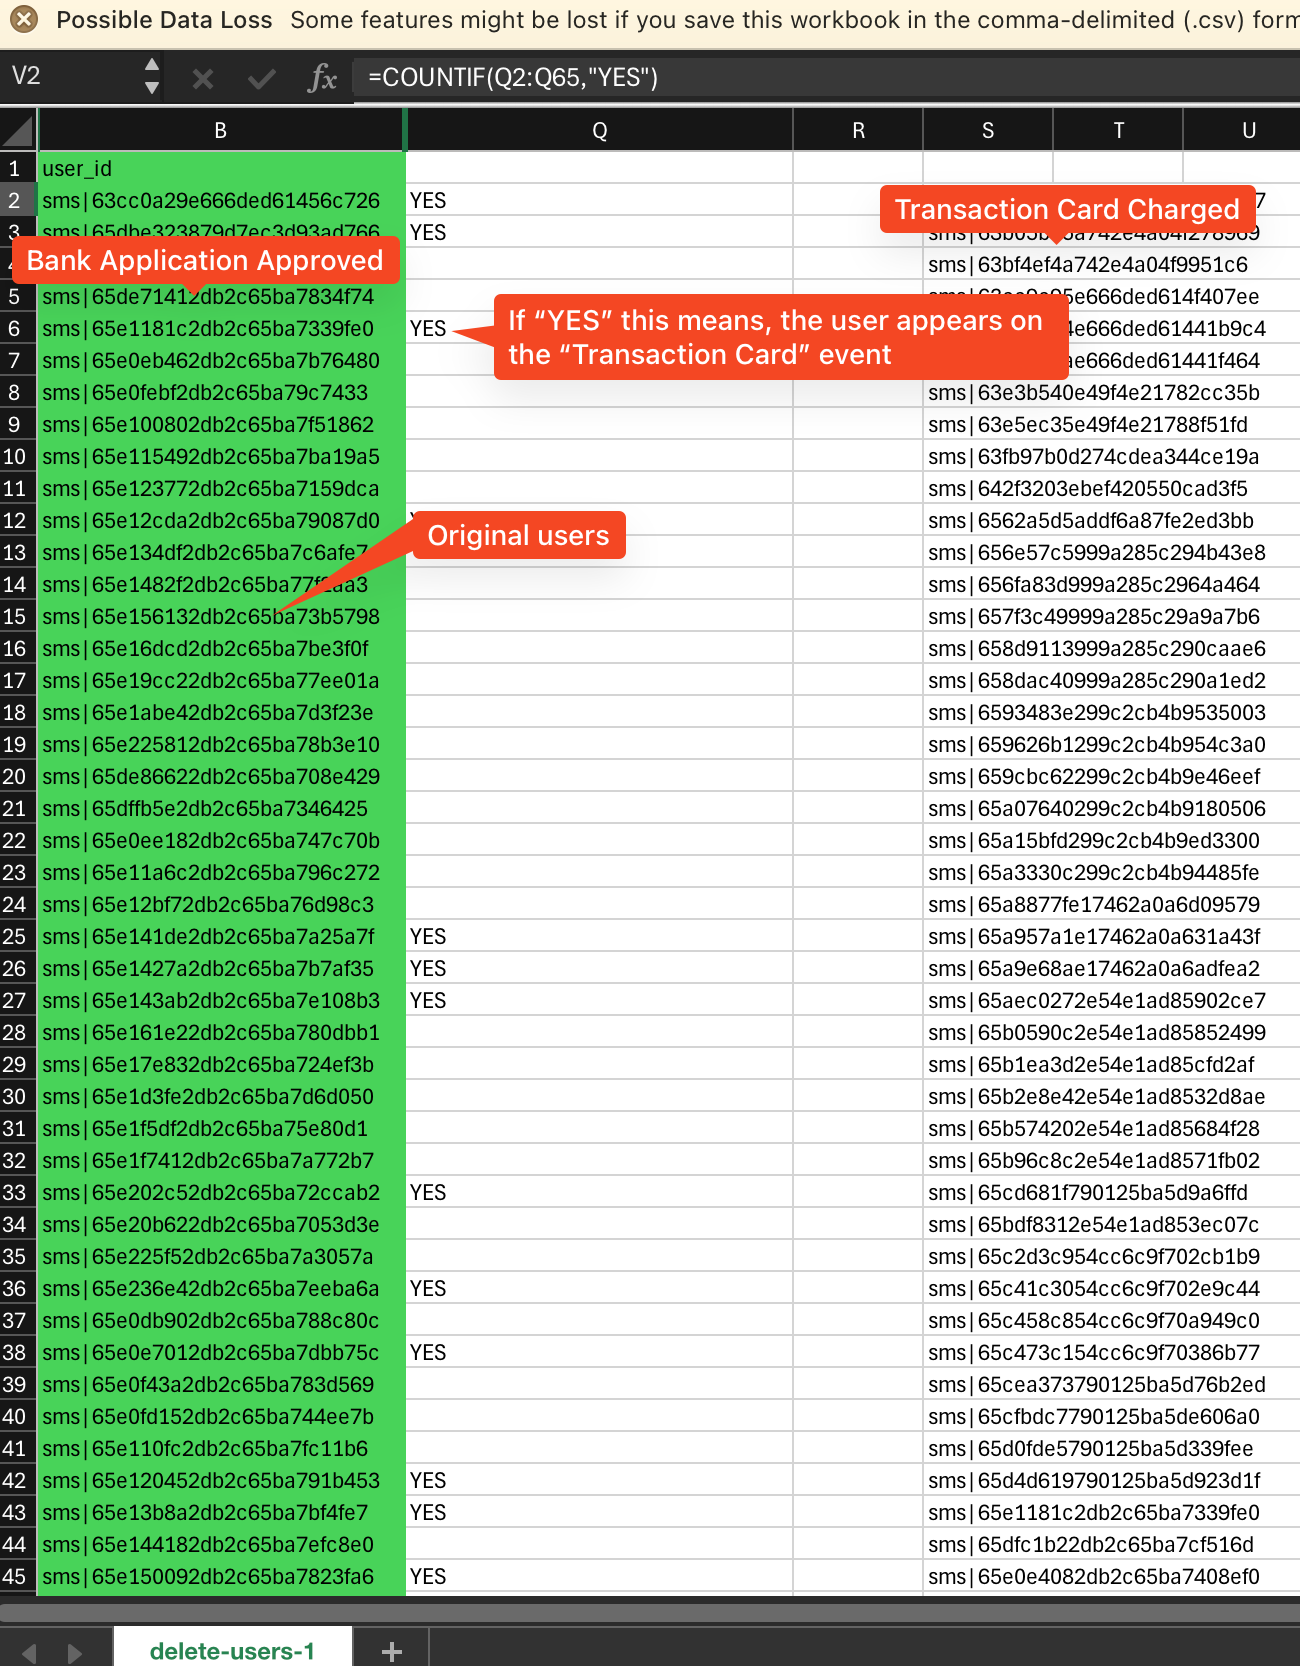
  1. I downloaded both user lists (Bank Application Approved and Transaction Card Charged for March 1st) in CSV format.
  2. I then extracted the userId into 2 different Excel columns.
  3. I matched Bank Application Approved’s userId with Transaction Card Charged

I got only 7 positives.


If I’m getting this right, there should’ve been 36 matches, but I’m seeing only 7. To clear things out, I decided to include March 2nd as well. But if I aggregate both March 1st, and March 2nd, I only get 14 matches.


Would someone be so kind to explain?

Or does that mean, that during the 30 day period, 36 users out of the 64 did end up transacting with the card?


Bump


Hi Jose,

To confirm your Event Segmentation chart data point only looks at users who did the event on March 1st correct? But your Retention chart is look at users who did the event in 24 hour windows? It also looks like your Retention chart is looking at 'Return On or After' not 'Return On'.

If those three facts are correct simply downloading the data point from March 1st on your Event Segmentation chart is not equivalent to Retention Analysis March 1st and you will not be able to 'recreate' or validate your Retention chart with Event Segmentation. Allow me to go through why each point will not allow you to recreated this in Event Segmentation:

**But your Retention chart is look at users who did the event in 24 hour windows**
This is because if you are doing 24 hour windows Day 0 means the user has 0-23 hours from when the user does the first event to return and do the second event. This means if the user did the first event on March 1st 3:00 PM they have until March 2nd 2:59 PM to do the return event. The user would therefore not show in the March 1st solely.

**It also looks like your Retention chart is looking at 'Return On or After' not 'Return On'.**
You do mention that you tried looking at the data points March 1 and March 2nd but only got 14 matches. This is because your chart is also looking at 'Return On or After' This means 'Day 0' is not really just Day 0 it includes all users who ever converted. For example a user who triggers the return event on day two, for example, will also be included in the data point for days one and zero. This view is documented here: https://amplitude.com/docs/analytics/charts/retention-analysis/retention-analysis-calculation#return-on-or-after

Overall it is hard to replicate charts since the logic is different from chart to chart but your current definitions make it especially hard. I would recommend altering your definition if you want to 'Return On' and 'calendar dates' if you want to compare your charts more accurately.

Best,
Sydney


P.S. Checkout upcoming events and user meetups on our events page.

Oh wow Sydney 🙏. Thank you very very much for taking the time to explain to me.


I think I understand much better now.


Hi Jose Asilis,

Thanks for the update! Is there anything else on this topic I can help you with?

Best,
Sydney


P.S. Checkout upcoming events and user meetups on our events page.

@sydney.koh Thanks a bunch!!!

I was about to write you another question, but I figured it out while I was writing it.


Thank you thank you thank you!!!


I’ll let you know if something else pops up!


Hi Jose,

Good job! In that case I will close this out for now. I hope you have a nice day!

Best,
Sydney


P.S. Checkout upcoming events and user meetups on our events page.

Reply