Hi all,
I set up a BigQuery connection to ingest custom event data into our Amplitude project. I can see the ingestion is running correctly, and the event counts on the BQ Connection show the expected number of events (19k for 8/29/2023):

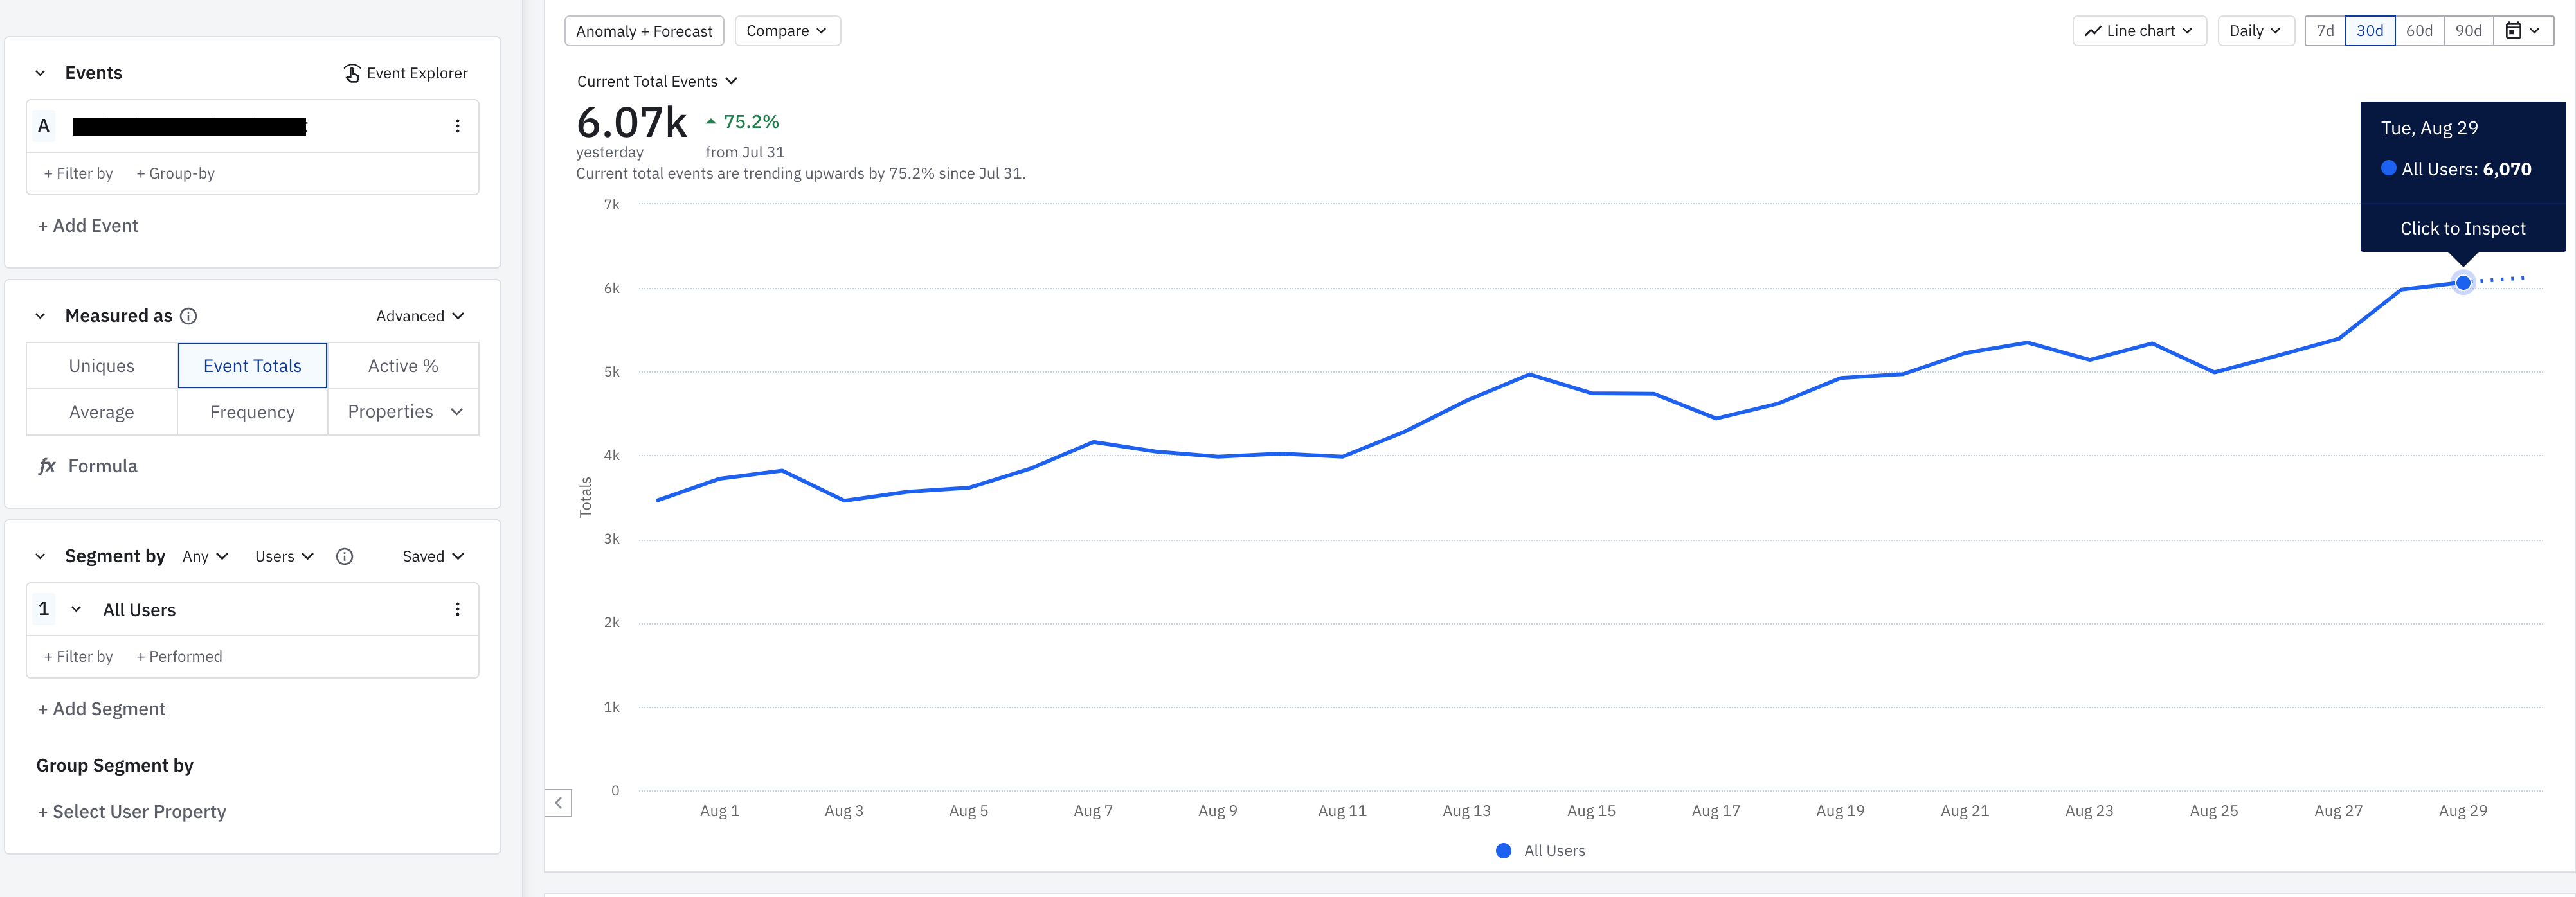
However, when building a segmentation chart for the same event, the count for event totals is much lower:

Is this a configuration issue somewhere? I would expect the event totals in my segmentation chart to match the number of ingested events by day in the BQ connection screen. TIA for any assists!


