Is there a way to create an ecommerce report where the ROW is a product name (such as large blue shoe) and the Metric is an event (such as view_item)?

Page 1 / 1
Hey
You can try Data Tables for this. Here’s a demo chart for quick reference for your use case.
Hope this helps.
Thanks
I’ve recently configured my Event Properties to use Splitting of the products array. I don’t see them available in the Data Table. Does it take time for those to populate?
Also, the Data Table doesn’t have any graphs. Is it possible to use a dimension from an array (such ‘product name’ and graph performance of a metric over time?
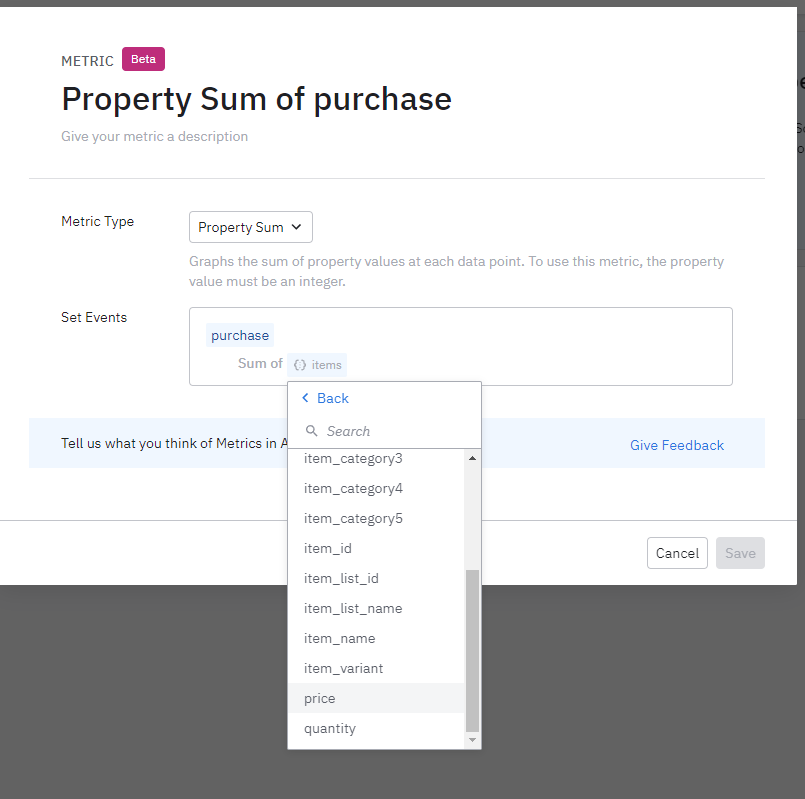
Also, any idea how to create a simple metric such as “product revenue”.
Product Revenue is the sum of the item’s price * quantity.
I’m not seeing how to do that within the Metrics beta. Price is generally not an integer (rather, it is a float), and it isn’t possible to multiply the value times quantity. I must be missing something.
Hey
Data Tables can be mostly used for summarizing your data into a tabular format and not for graphing trends over a time frame. For that, an event segmentation chart like this will help.
I haven’t played around with the Metric feature that much, but looks like it focuses more on the Sum part than the ability to multiply values for now.
Since you are sending the price and quantity as separate values on the purchase event, I’m not sure what’s the best way to use that in Metric. In the demo environment, Amplitude is capturing the $revenue property and summing that up on their purchase event .
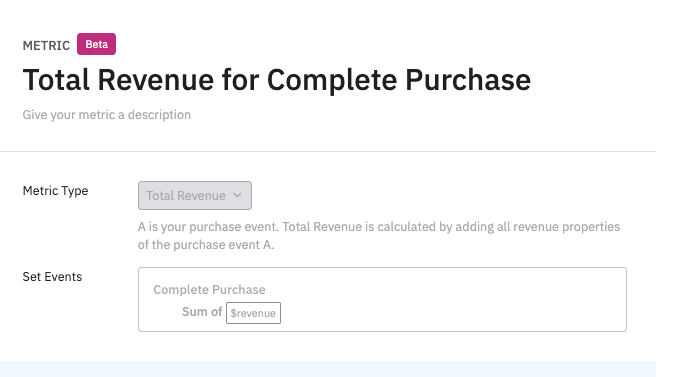
More on the $revenue properties here.
You can also try to use Derived Properties and create a revenue property using the MULTIPLY formula.
Hope this helps.
Reply


Welcome to the Amplitude Community!
If you don't have an Amplitude account, you can create an Amplitude Starter account for free and enjoy direct access to the Community via SSO. Create an Amplitude account. You can also create a Guest account below!
If you're a current customer, select the domain you use to sign in with Amplitude.
analytics.amplitude.com analytics.eu.amplitude.comor
Welcome to the Amplitude Community!
If you don't have an Amplitude account, you can create an Amplitude Starter account for free and enjoy direct access to the Community via SSO. Create an Amplitude account. Want to sign up as a guest? Create a Community account.
If you're a current customer, select the domain you use to sign in with Amplitude.
analytics.amplitude.com analytics.eu.amplitude.comor
Enter your E-mail address. We'll send you an e-mail with instructions to reset your password.