What chart should I use to anlyze the time when user came back.
I have made user cohort as below.
the user who have first opened my app during 4/23~5/22 time frame, then converted to sign in within 1day after first open app event.
then I used the retention chart with this cohort
to see the unboudned retention, as I wanted to know
how many users never cameback even after creating an account (sign in event)
Day0>Day1 day 1 unbounded retention was let’s say 50%.
and I re created cohort of the ones who did comeback, to see what these users are doing after coming back.
In the user session chart, I cannot select 2nd session or the session after the sign in session.
Is there any other way to see what the users are doing after coming back?
thanks
with best regards, Flor Cho
Page 1 / 1
Hey @flor.cho , If I understand your use case correctly, you are trying to see the event flow ( what users are doing ) of the users who come back as per your retention criteria ?
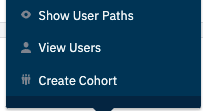
A user session chart would just show time/session based metrics and not really help in seeing what the user flow looks like. A better option would be to use the “Show User” option in the Microscope of your retention segment or the Pathfinder with the appropriate cohort.
Note : Pathfinder Users is only available on the Enterprise, Growth, and Scholarship plans.
Let me know if my interpretation here is correct.
Hi @flor.cho -
That’s exactly along the lines of what I was thinking, too @Saish Redkar! Thanks for your idea. Agreed - a great way to see what users are doing after the sign in event would be to utilize the Pathfinder chart. You could apply your cohort to the Segmentation Module on the right hand side and set the Events Module on the left hand side to start with the event sign in. You'll be able to view the top paths taken after a user performs the event sign in.
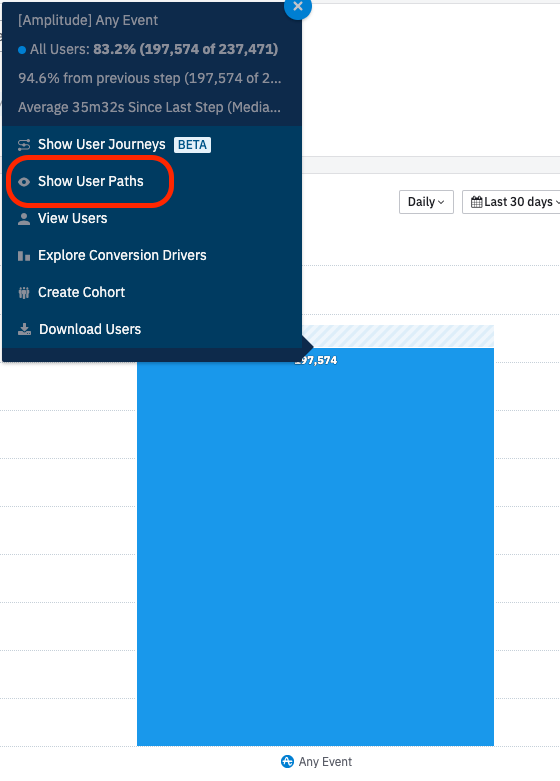
Another idea I thought of would be to use the Funnel Analysis chart to view users that went from sign in to start session to any active event. Here is an example chart. In this chart we have the funnel: User Sign Up > Start Session > Any Active Event. You are isolating the users who have started a session after their sign in session. You can then click into the Any Active Event bar and click Show User Paths to explore what users did:
Hope this helps!
Hi both! and thanks for your great suggestions
for the path finder chart @Saish Redkar I wanted to know about the users who have returned in 24 hours after their session which they successfuly finished signing up.
This is because the unbounded retention let me know there are pretty much users who never visit back even after signing up.
so, I have cohort from the retention chart( unbounded Day1 retention survived user cohort), then if I use Path finder chart starting from sign in, I can see the event flow, but the ones I think that has happeed right after the sign up, let’s say, view sign up confirmation.
I would like to know more about why they have cameback, and what they have done once they came back. Can you give me another idea to get a closer look at this?
@jmagg Thanks for your suggestion,and I tried to create my own funnel chart with “start session” and “any active event” however, we don’t have ‘start session’ event(maybe because we have implemented using API rather than SDK), only in the Path finder chart, I can check the “start session” event that are predefined by Amplitude.
Thus I tried out “sign in” “sleep app” “open app” “any active event” instead in the funnel.
But I know that this doesn’t mean that they have came back. as this funnel will show me any user who have completed to any active event with in 1day from sign in.
(and I would rather like to know who have completed to any active event after day1 but before day2
and this funnel chart’s time to convert shows 7~8m, which means they actually did not comeback the other day.
If there’s any other way, please let me know
thanks!
There are two ways to think about this: you can try to make do with what you have or specify your data in a way that you can answer the questions you need.
Do you have an event that the users would reliably do for the first or second time when coming back to the app? For example, we have a landing page we call HomeScreen in Amplitude. When the user signs up, they go from SignUp to HomeScreen, and when they come back to the app, they land directly on HomeScreen.
If so, you could use the Historical Count property to define your starting point in Pathfinder and see what comes up.
Alternatively, if this is big question for you, I would consider setting up a custom event (“returned after signing up”) or user property (“session count”), so you could drill down very precisely to this.
Generally speaking, you can do very precise analysis in Amplitude, but you need to make sure your data matches your needs. This is why I always ask our business people to tell me the questions they want to answer, rather than the data they want to track.
Thanks That was very helpful!
we have event called “view main” which you should experience almost whenever the new session starts.
I have checked “event performed within sessions” with the event “view main”
and ‘average events per session’ was close enough to 1.
and then I checked the ‘average session per user’ daily, which was generally 2~3.
thus I thought that the Day0 they will have 2~3 sessions including 1 average view event in each sessions, and when the Day1 session starts, they will be firing “view main”event with the historical number of 3~4.
Then I used path finder chart
starting with “view main” where historical count is greater than 3
I think this will give us aproximate understanding of what our users do from Day1~
if they have returned.
There can be some loopholes as I have used a lot of ‘average’ values,
but I guess this can give us an overall idea.
thanks for your ideas, and that really helped a lot.
If you don't have an Amplitude account, you can create an Amplitude Starter account for free and enjoy direct access to the Community via SSO. Create an Amplitude account. You can also create a Guest account below!
If you're a current customer, select the domain you use to sign in with Amplitude.
If you don't have an Amplitude account, you can create an Amplitude Starter account for free and enjoy direct access to the Community via SSO. Create an Amplitude account. Want to sign up as a guest? Create a Community account.
If you're a current customer, select the domain you use to sign in with Amplitude.