Solved

Visualizing grouped data


Badge

We’re tracking an event when a user attends one of our sessions - grouping these events by the session ID, we’re able to see the attendance for each session (see below):


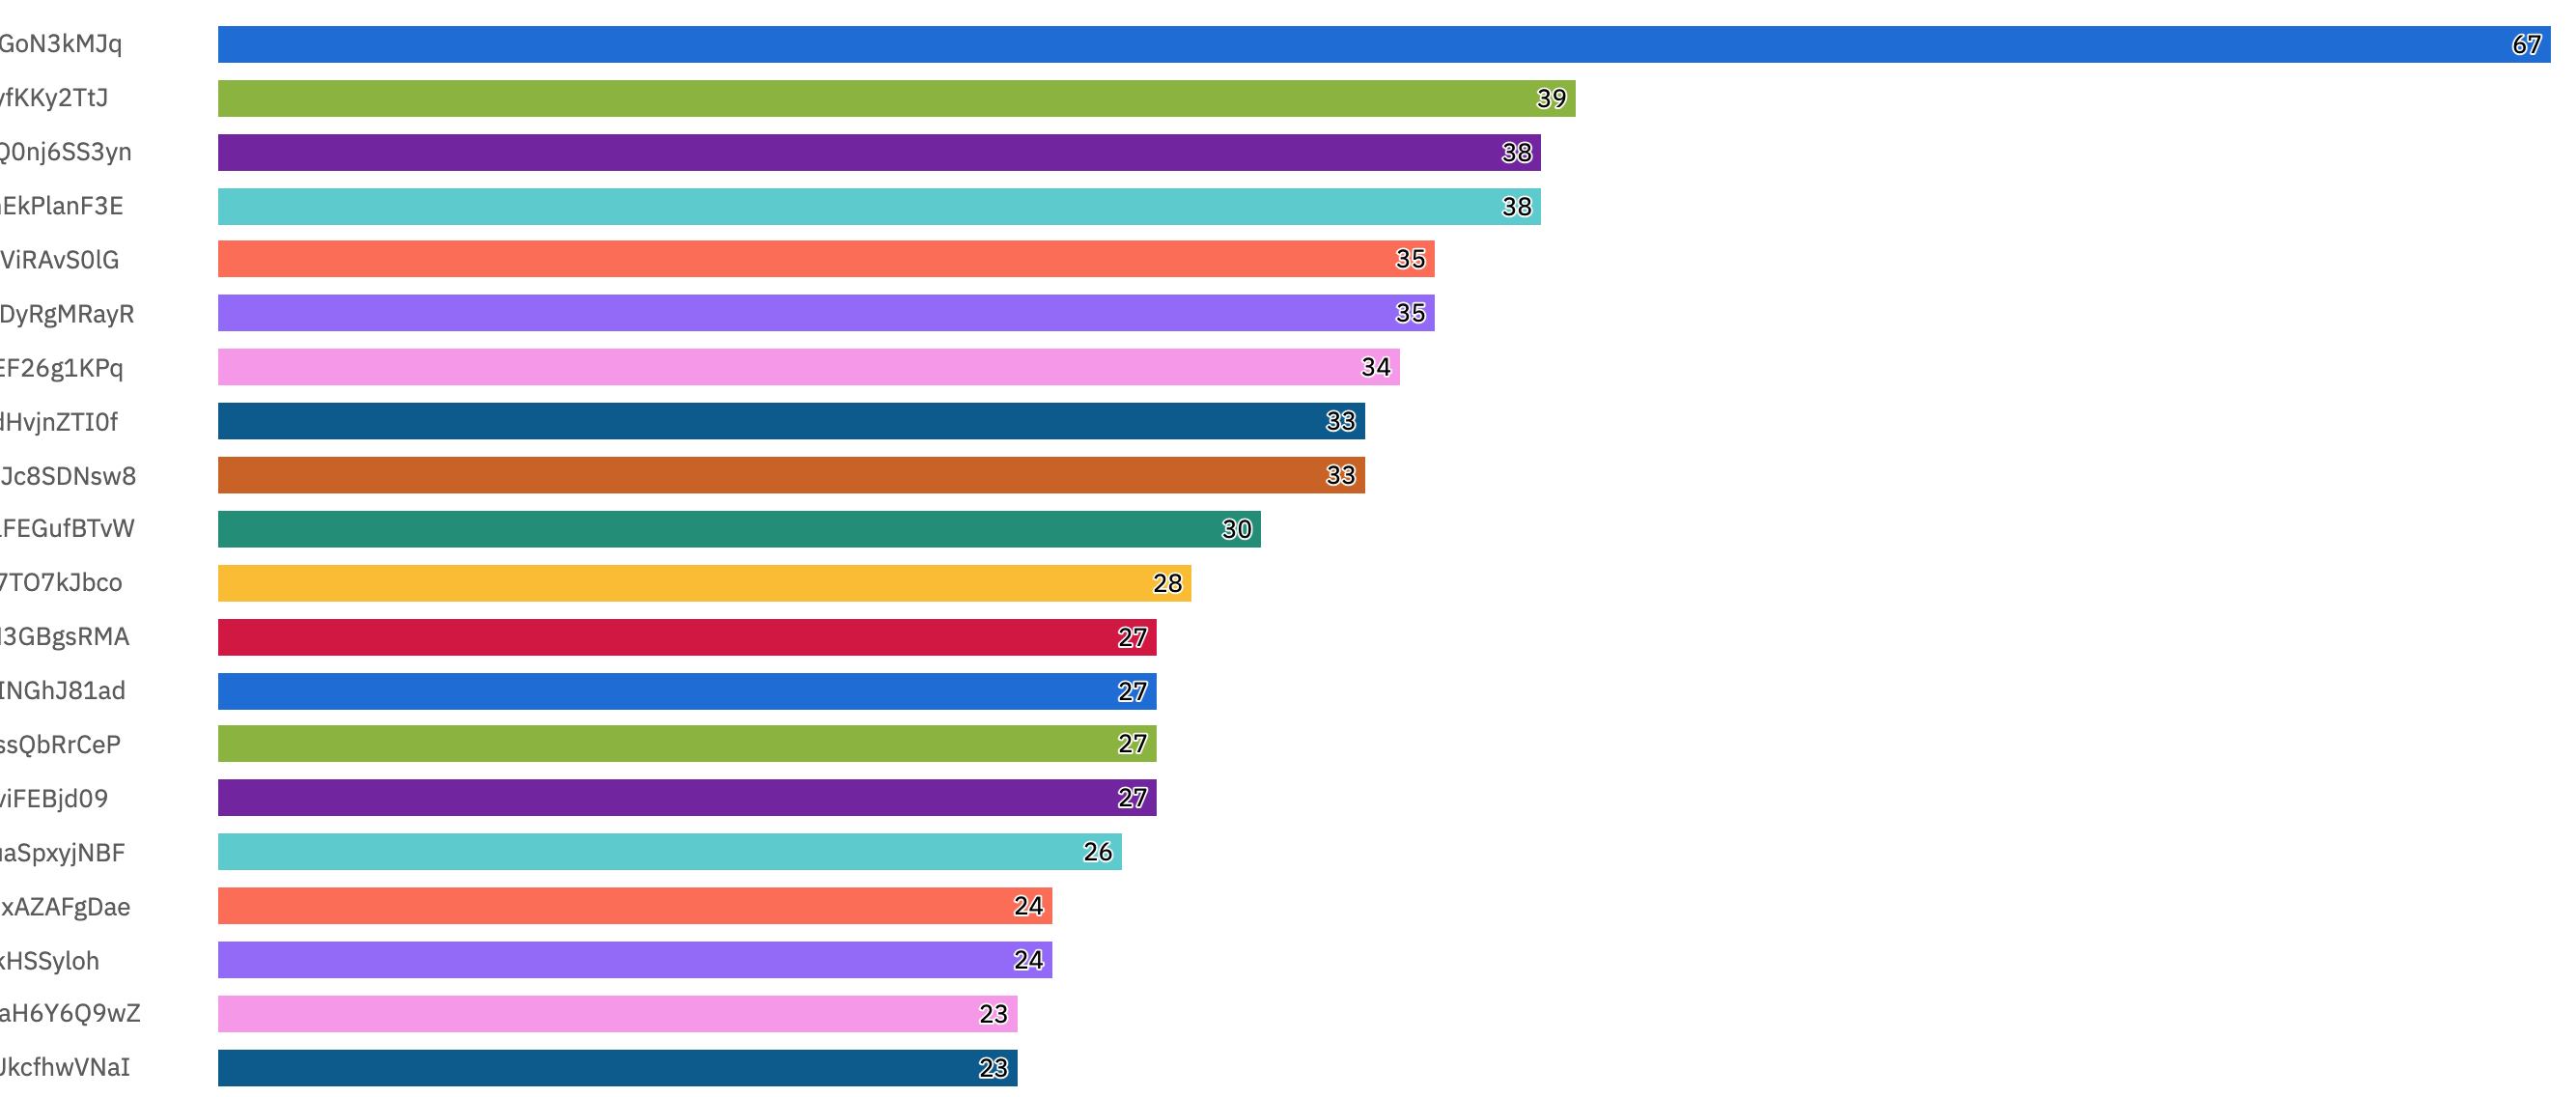
What we’d really like to see is the data organized a little differently - a histogram of how many sessions were attended by 0-20 members, how many were attended by 20-40, how many by 40+. Is there any way for us to do this?

icon

Best answer by Saish Redkar 16 May 2022, 16:16

View original

2 replies

Userlevel 6
Badge +8

Hi @rahulsekhar ,


If this is an event segmentation chart, you could try to use the Frequency metric module but I am not sure this is exactly what you want to do. I believe you want to manually edit the groupings into buckets of 20, correct? In which case, there would unfortunately be no way to do this in Amplitude at the moment. 


If I misunderstood, can you post the chart URL and what you are trying to achieve? I can then have a peek and see. 

Userlevel 7
Badge +10

Hey @rahulsekhar 

The frequency metric might help as Denis suggested if a user  attends a unique session only once, but the bucketing might not be possible.

I’m assuming this is an “Attended Session” event on a user level with the session ID ( more like the session’s unique meeting ID I believe to avoid confusions with a user session ) and you are grouping by the session ID to get this chart?

From what I see, this schema might not help much in answering your question.

Do you have any event instrumented when a session gets completed? This might have to be a standalone admin kinda event to get the desired results instead of per user.

e.g “Session Complete” with an event property of #_attendees.

Using this schema , you can use try using the Distribution of Property Value metric in the event seg chart to get the answer.

Similar to a Song Played event with duration property distribution as seen here , with #_attendees as the property you wish to see the distribution for.

Also, it seems like sessions is a “group” which seems to have different attributes that you are trying to answer questions for. I would recommend looking into instrumenting your sessions as a group if that helps better for your various use cases.

Let me know if I’m missing some additional context here.

Reply