Hey everyone,
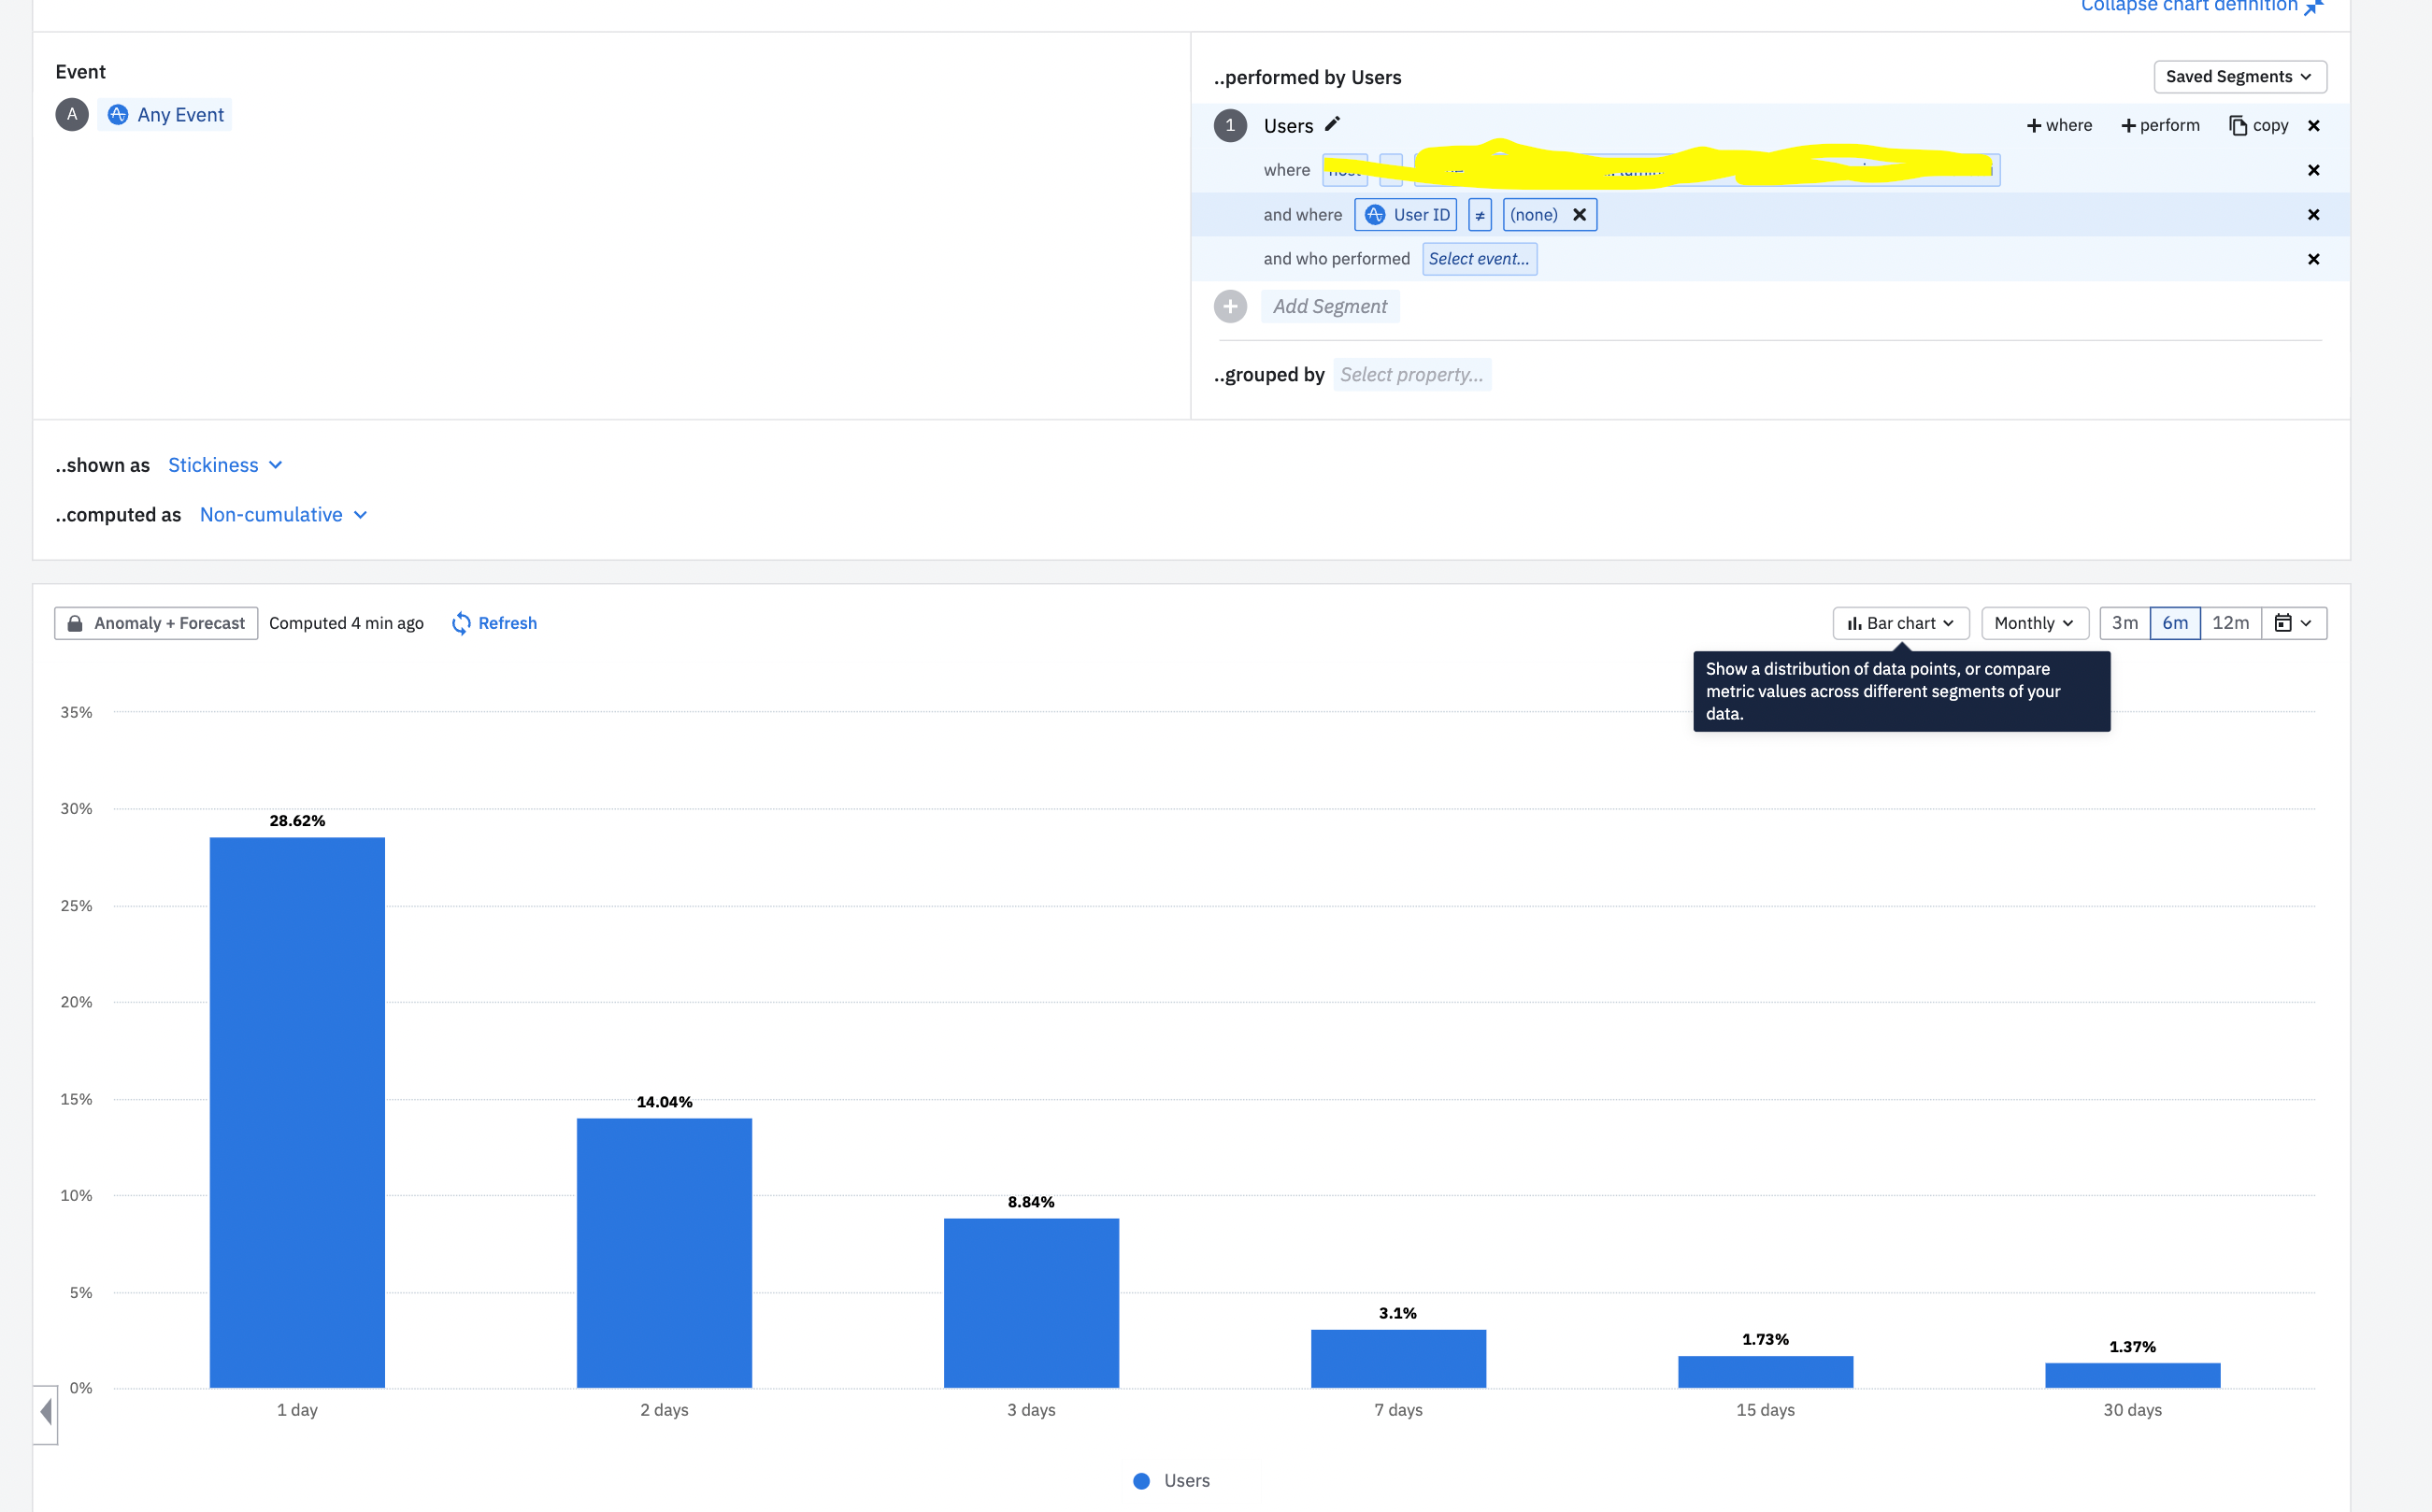
I created a stickiness graph and set the event = any event.
My two questions are:
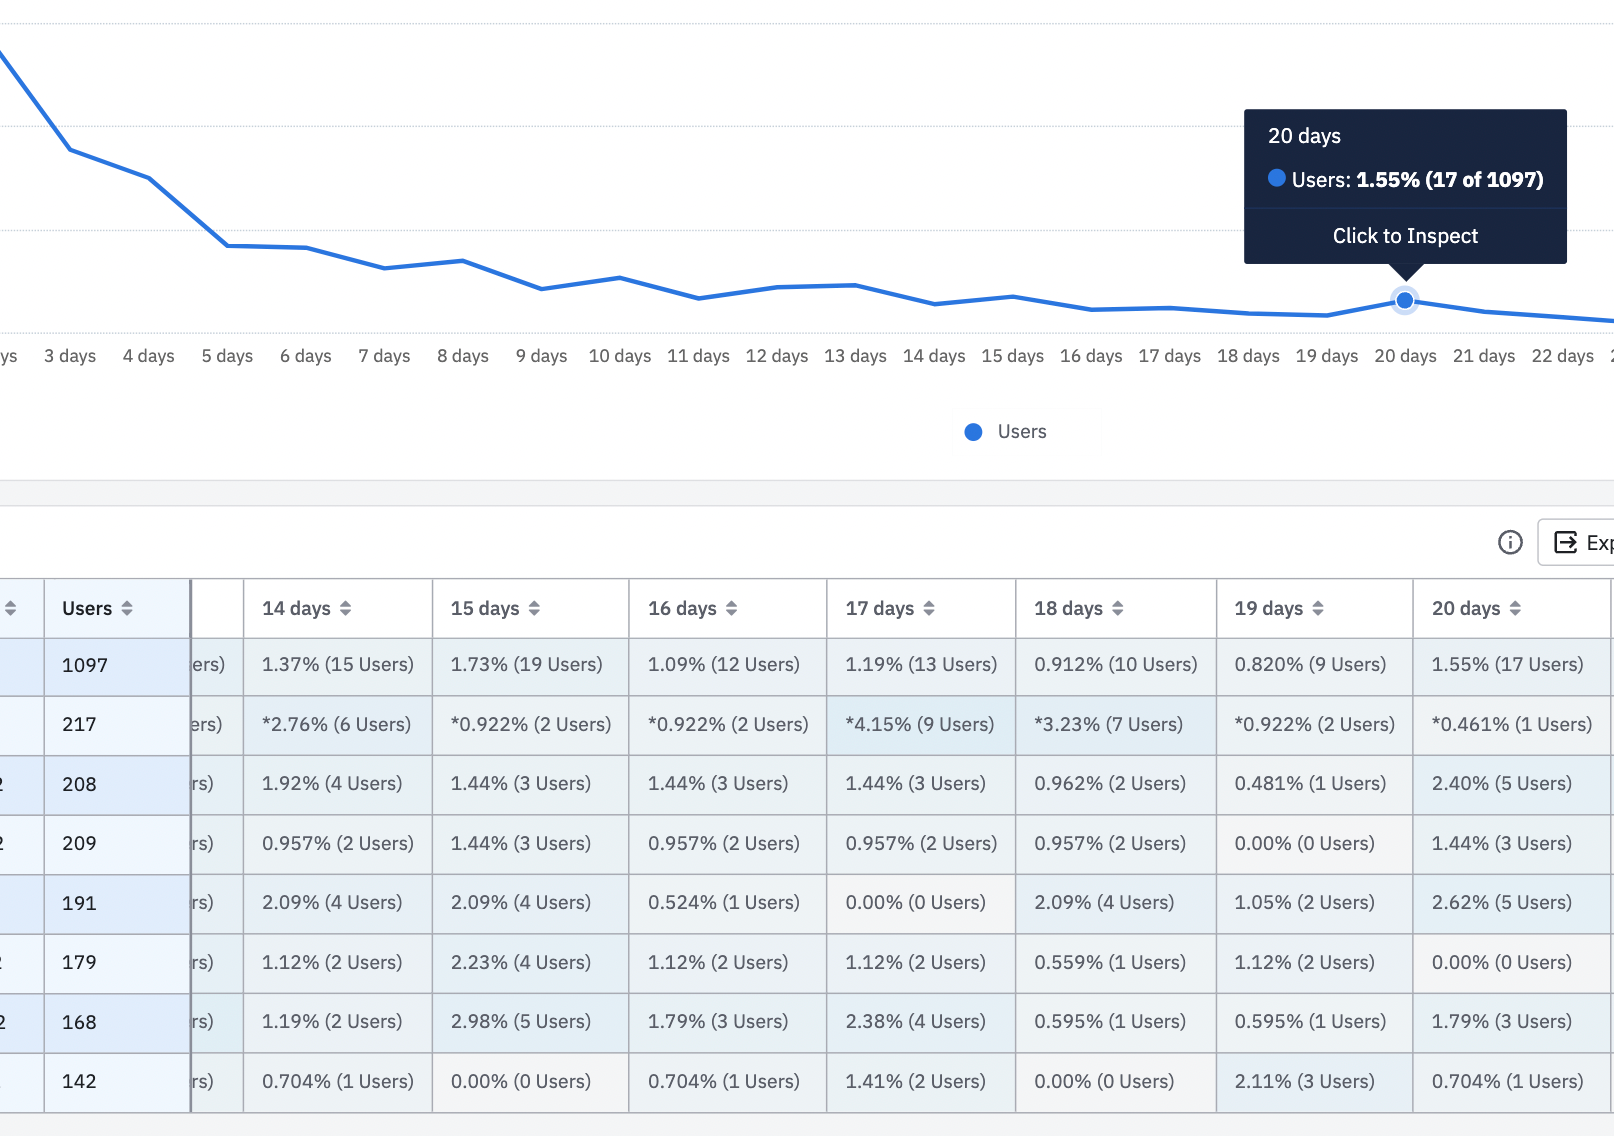
- Why can I only see 6 days in the bar chart view?
- What learning can I draw when the event is set to any event and my 1 day bucket is at 29%? Does this mean my users perform a lot of events which I am not tracking yet?
As always looking forward to your replies :)


