Hello,
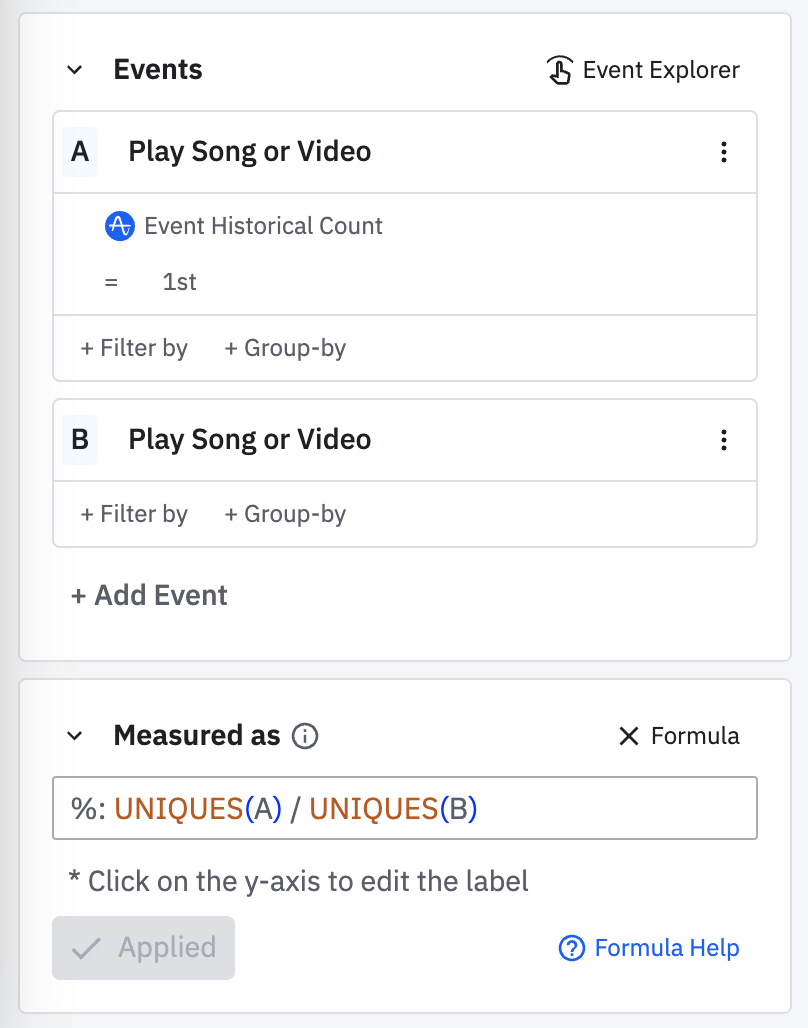
I’m trying to figure out how to make “What percent of active users are returning” chart right.
We’re receiving lot’s of different events in our Amplitude project but for the purpose of this chart we only rely on 1 event, let’s call it EventA.
So, the “New User” event in our case is EventA fired by a previously unknown user. And for the “Any active event” we simply use the same EventA.
Can you please suggest how to configure the event segmentation chart to reflect this requirements?
Vlad


