Solved

Meaning of 'Overall % Active' in Segmentation chart.

  • 22 August 2023
  • 2 replies
  • 108 views

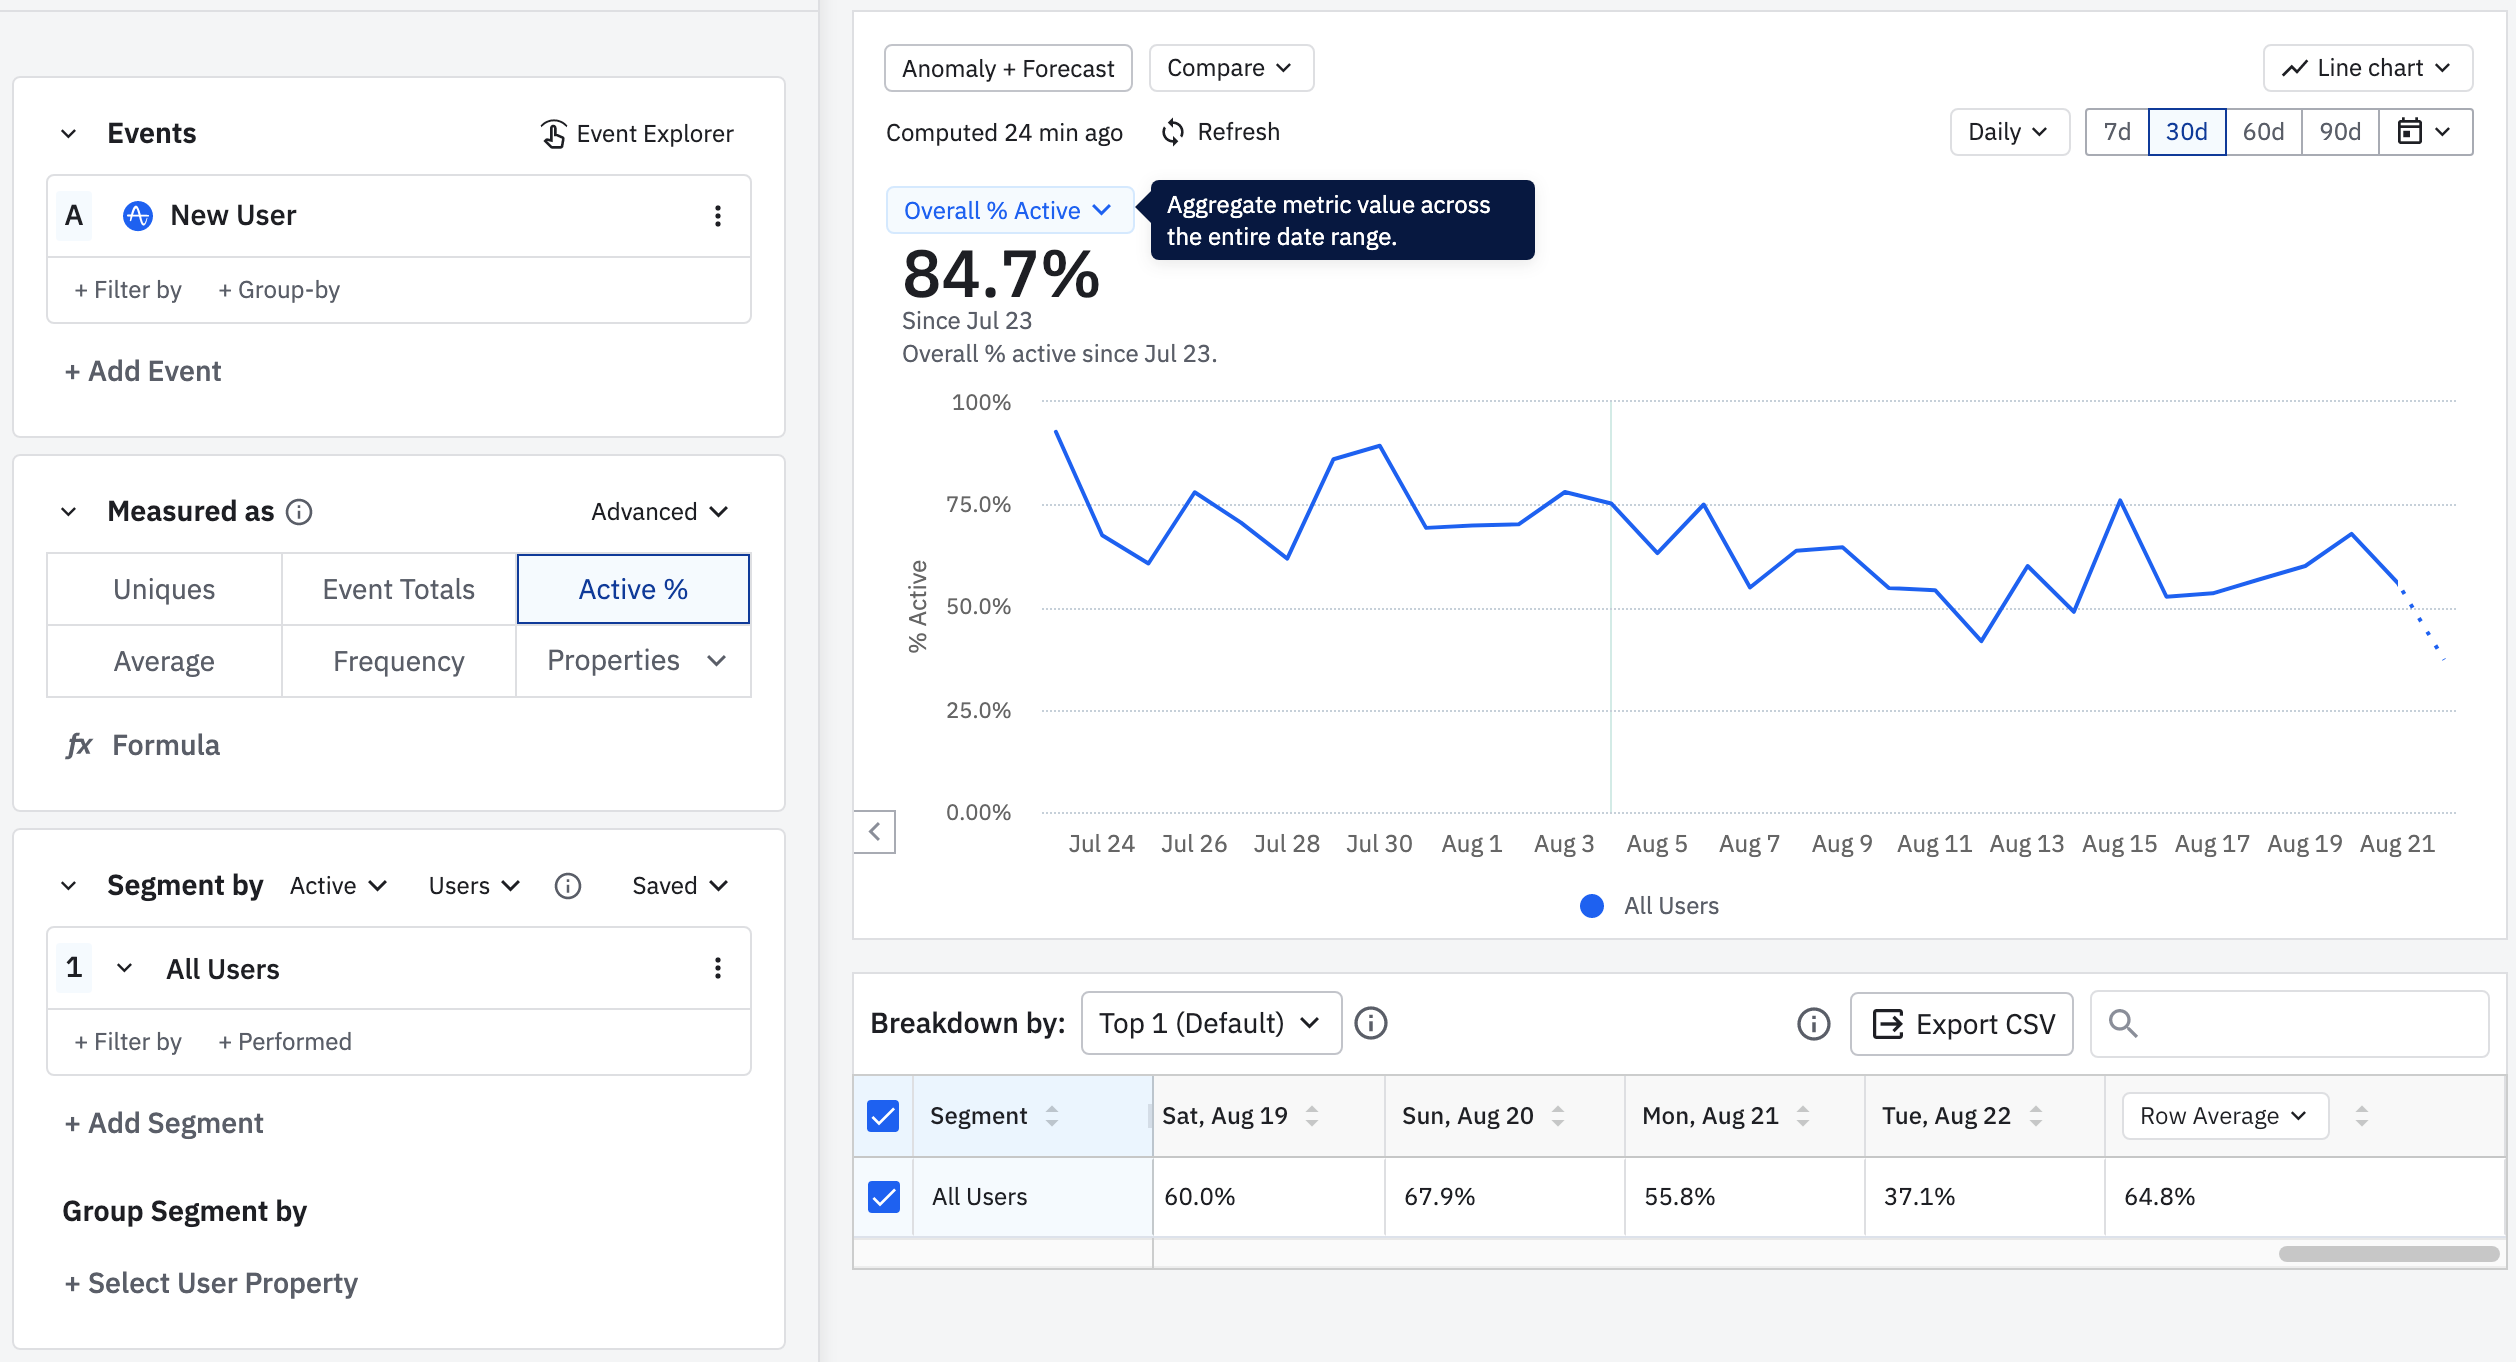
In the description of the tooltip in part ‘Overall % Active’ of the chart, it is written as 'Aggregate metric values across the entire date range.’ But I don't understand what it means.

When comparing ‘Overall % Active’ with ‘Current % Active’ or ‘Average Values’, the level of ‘Overall % Active’ Metric is much higher, so why?

plz, explain it easily.


icon

Best answer by Saish Redkar 30 August 2023, 12:53

View original

2 replies

Userlevel 7
Badge +10

Hi @DJ.Lee 
Since you are using the % active metric on New User event, here’s how to interpret this :

  • The overall % active gives you the % of your total active users who performed the “new user” event in the last 30 days i.e. 84.7% of all your active users in the past 30 days were new during this time period
  • the current % active will give this datapoint on the last calculated day in your chart , which I think is Aug 22. So of all active users on Aug 22, 37.1% seem to have been new on that day.

Hope this helps.

Hi @DJ.Lee 
Since you are using the % active metric on New User event, here’s how to interpret this :

  • The overall % active gives you the % of your total active users who performed the “new user” event in the last 30 days i.e. 84.7% of all your active users in the past 30 days were new during this time period
  • the current % active will give this datapoint on the last calculated day in your chart , which I think is Aug 22. So of all active users on Aug 22, 37.1% seem to have been new on that day.

Hope this helps.

Thank you, @Saish Redkar : )

Your answer resolved my question.

Reply