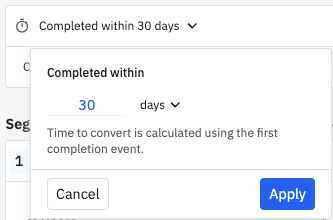
I currently want to make a funnel chart between event A and event B. I want to see the percentage of users who complete the funnel within 30 days of performing event A, as well as percentage of users who complete the funnel, but beyond 30 days of performing event A. Is this something possible to do?


Thank you!

Hello,

Thank you for writing in! My name is Audrey, and I am your Technical Support Agent here to help you.

To see the percentage of users who complete the funnel beyond 30 days of performing Event A, you would need to create a separate funnel with a conversion window set to a timeframe beyond 30 days.

I hope this helped! Please let me know if you have any questions.

Best,
Audrey


P.S. Checkout upcoming events and user meetups on our events page.

Hey @liuaud, thanks for answering! How would you make the conversion window to beyond 30 days? So I want a funnel that shows conversions from A to B only past 30+ days, but not anywhere less than 30 days. So something like “beyond 30 days” instead of “within 30 days”.


Hi peckerbids,

Apologies, I meant to make a conversion window within something more than 30 days. Unfortunately our Funnel chart doesn't directly support a 'beyond X days' filter at this time.

However, you can potentially work around this by creating a cohort of users who performed Event B 30+ days after Event A, and then apply that cohort to a new Funnel chart. If it helps, you can read more about how to create a cohort here.

We do, however, take customer feedback seriously. If you'd like to see a 'beyond' option in our Funnel chart, please submit a feature request via the help button at the top right corner on the UI (question mark icon) > Contact Us > Select 'Feature Request' > Submit Feedback. This will send your feedback to the Product team directly.

I hope this helps! Let me know if you have any other questions.

Best,
Audrey


P.S. Checkout upcoming events and user meetups on our events page.

Reply