This article is a guide to empower Amplitude users to investigate MTU overages. Refer to this article for any MTU billing questions. Refer to these best practices for guidance on how to set User ID tracking.
If you have any concerns on your current MTU usage for the current month or last month, review the details below on how to
Identify your org’s MTU usage for the current month
Login to your Amplitude account and navigate to the Settings < Plans & Billing < Usage tab.
You can view your account’s MTU usage (or Event Volume usage, contingent on your contract quota type) for the last 12 months, alongside your plan asset limits.
- ✅ If you see a consistent % increase MoM in MTUs, that might be true healthy active user / product growth.
- 📈 However if you pinpoint large fluctuations or a concerning spike in MTU / EV volume in a given month, this might be due to anomalous instrumentation.
Also take note of the light blue bar for the current month’s projected volume based on the current rate of consumption.
If you see green bars in your usage chart (refer to the 3rd graphic below), these are additional synthetic MTUs, which are essentially “spammy users” that can be counted more than once after your quota limit is reached. Use the instructions below to monitor this data further.
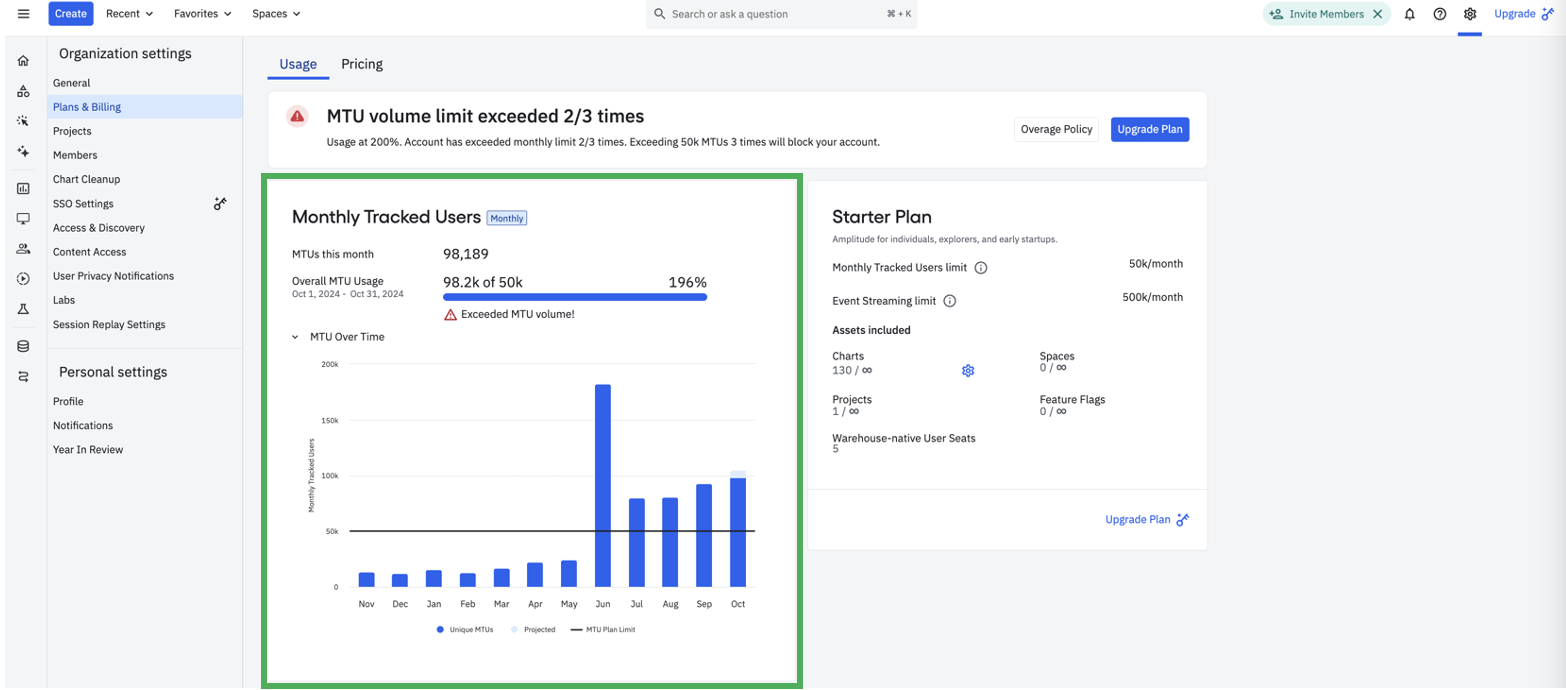 Sample Plans & Billing screen for an MTU Starter customer
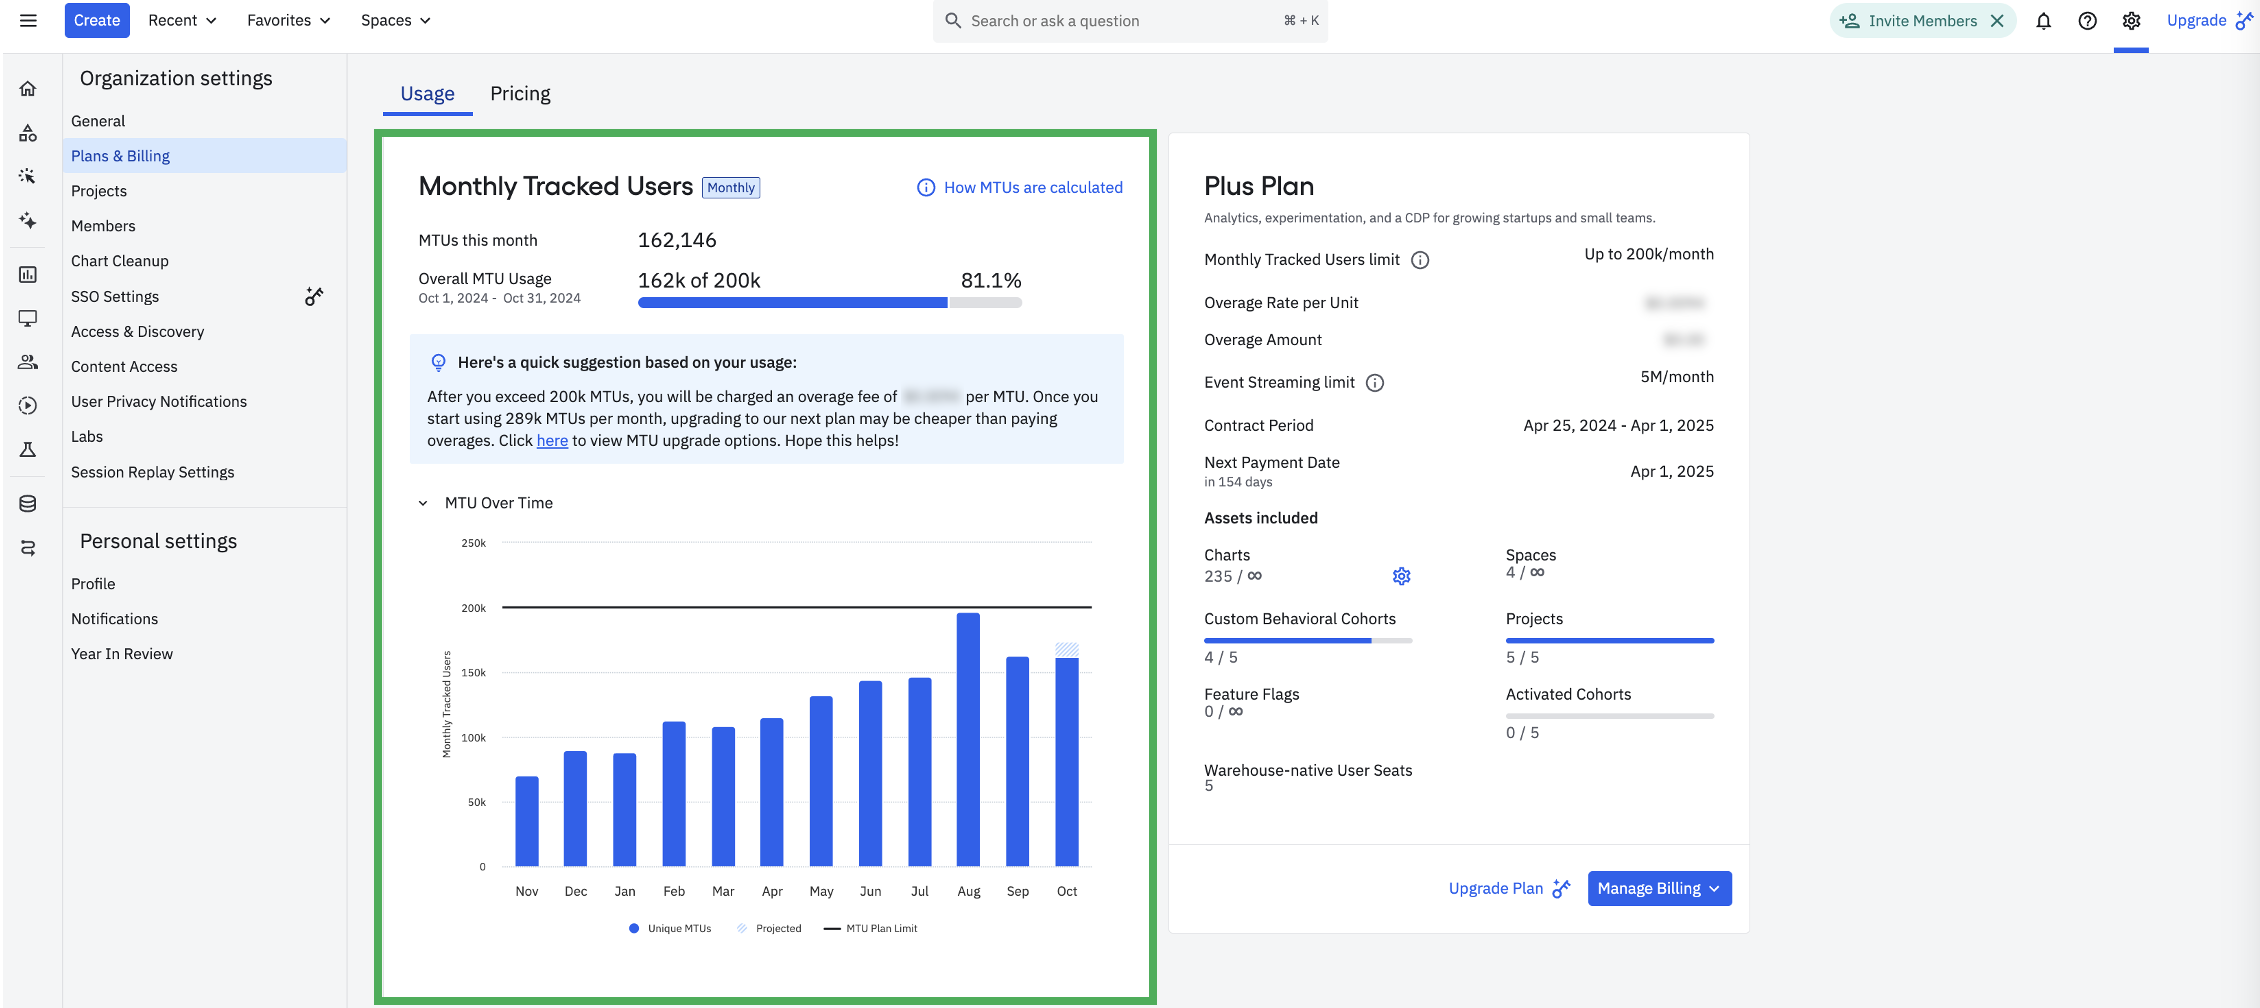 Sample Plans & Billing screen for an Event Volume billed Plus customer
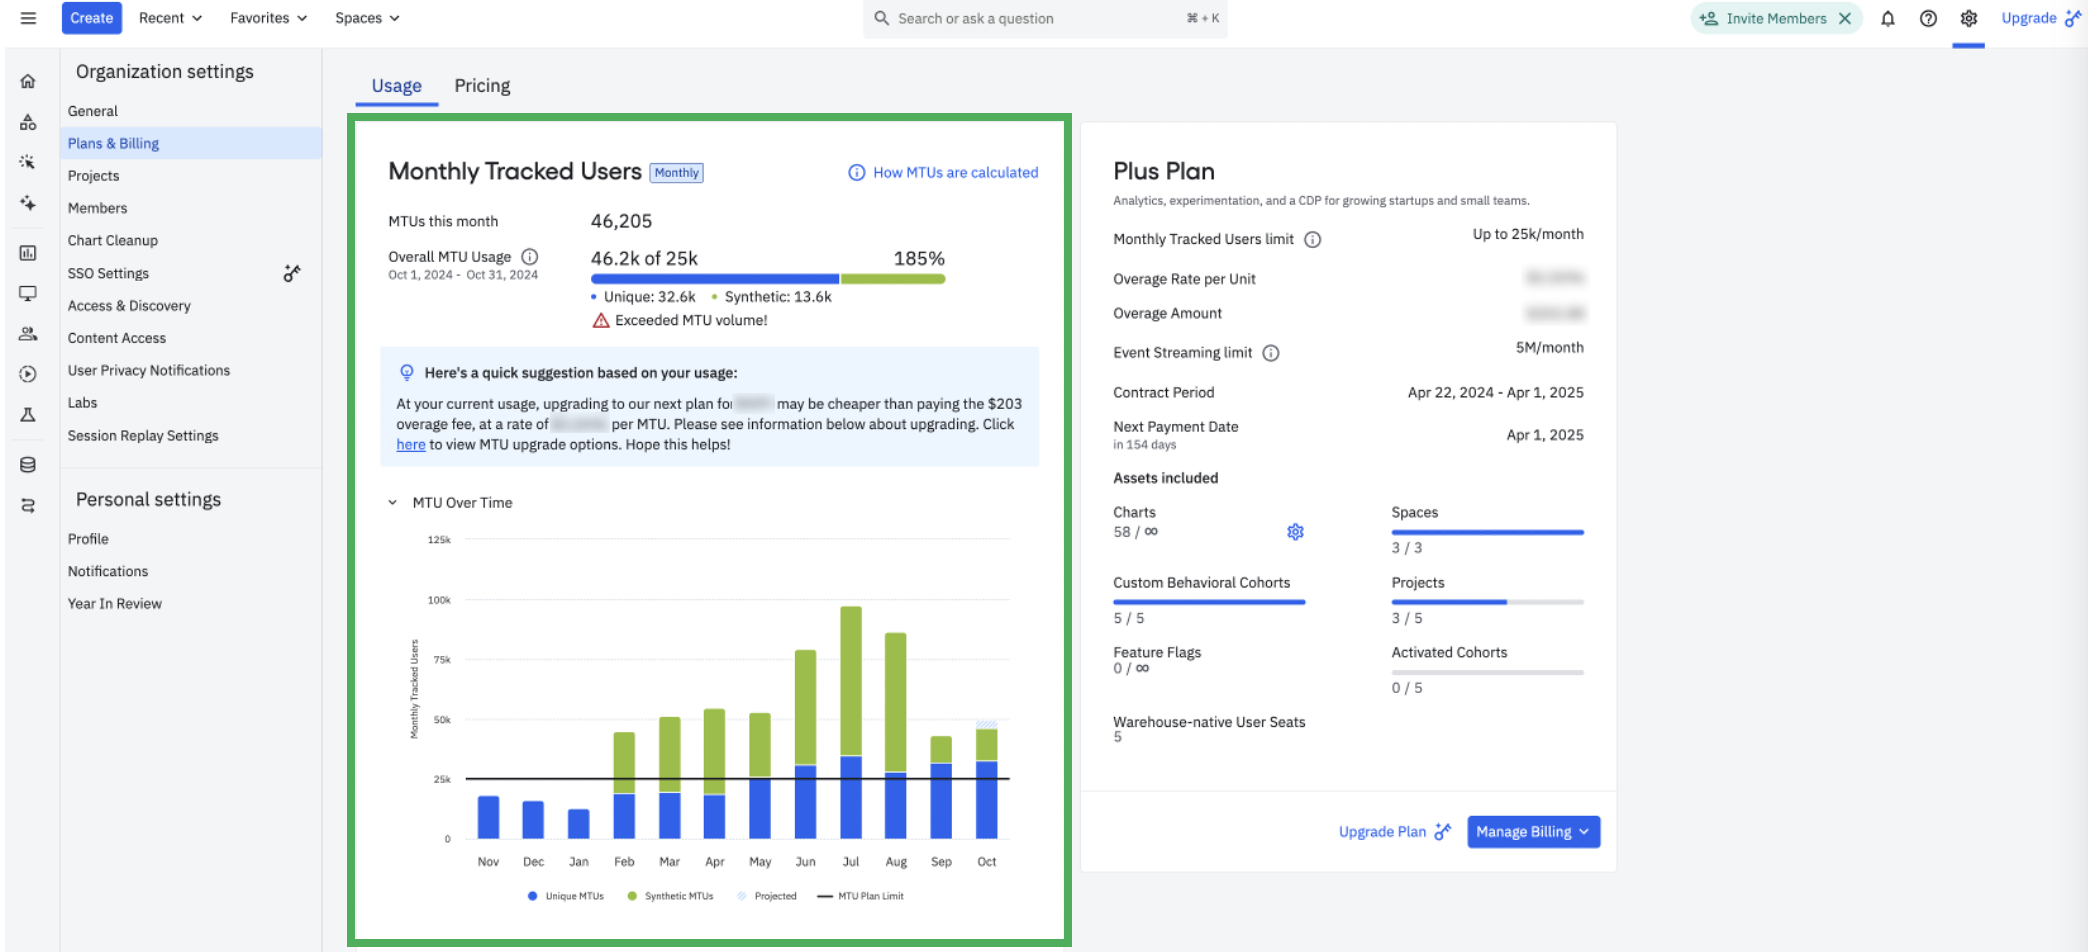 Sample Plans & Billing screen for an MTU billed Plus customer with Synthetic MTUs
Data exploration on backfills, anonymous users, and project deletion
Step 1: Identify backfilled data
Backfilling data is a common cause of spikes in MTU usage. Let’s investigate if a project is sending events to Amplitude with older timestamps (aka backfilling data). *If you have multiple projects, make sure to recreate the analysis for all projects.
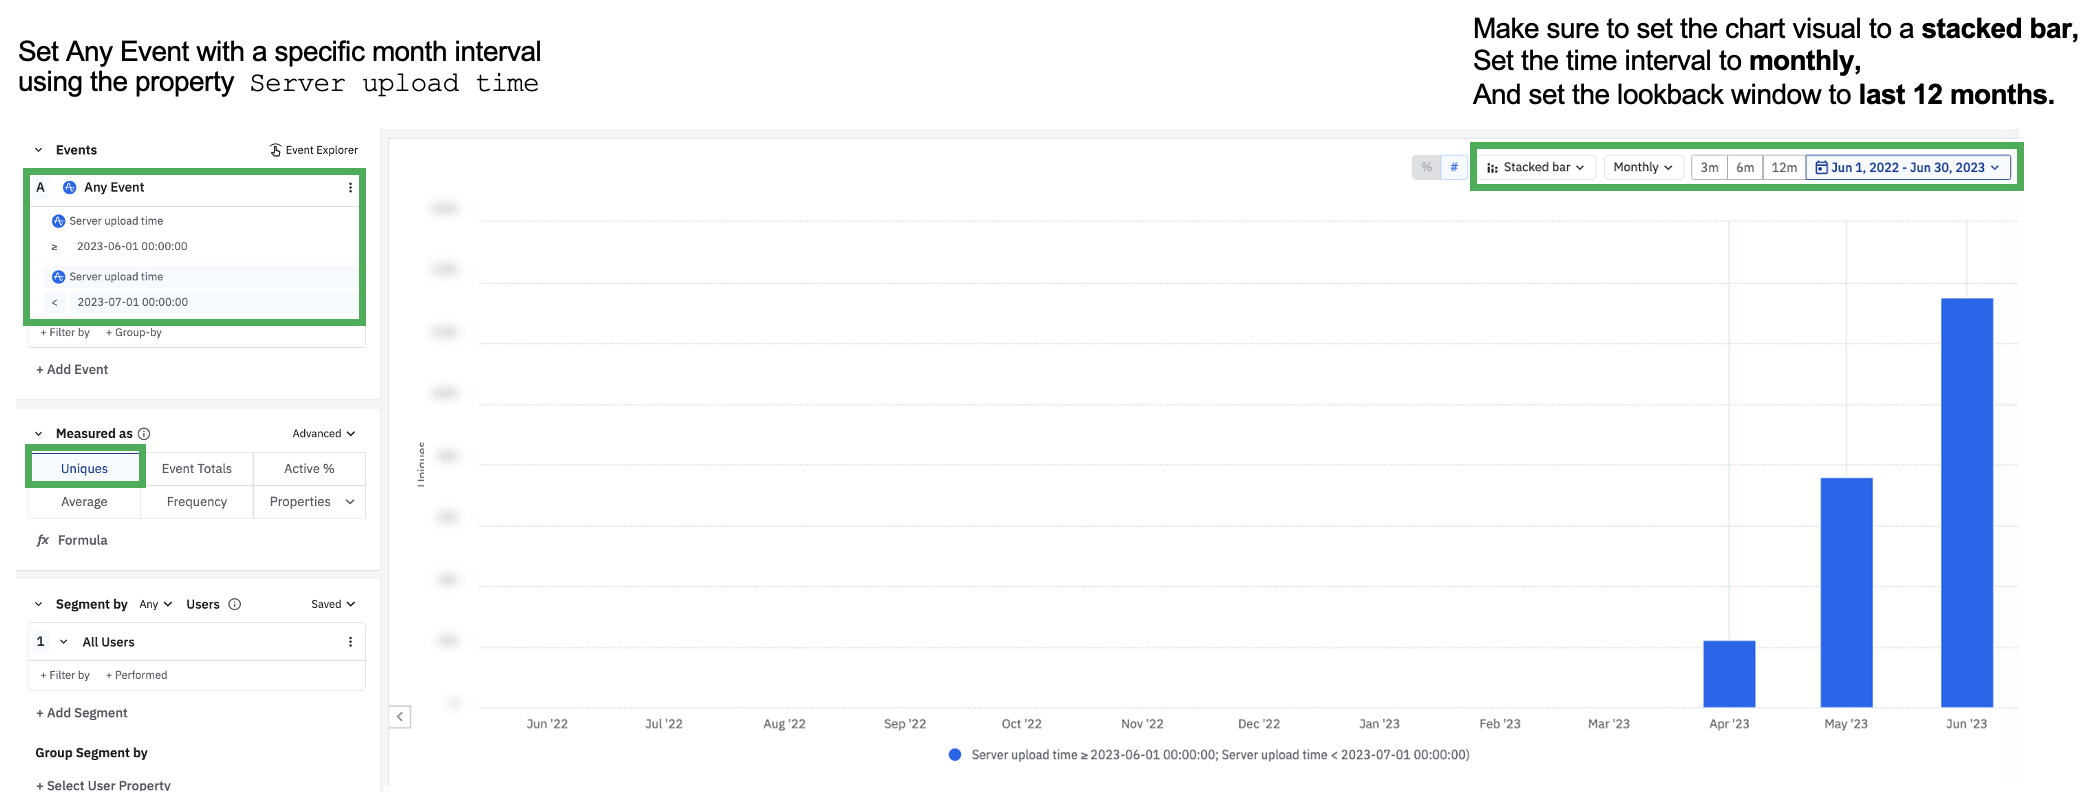
Within your project(s)*, build an event segmentation chart with a stacked bar visual and a monthly time interval. Then select Any Event and set the
Server upload time ≥ the start of the month for the investigation e.g. 2023-06-01 00:00:00Server upload time < the start of the following month e.g. 2023-07-01 00:00:00
 In this analysis, Amplitude received events for unique users in June (server upload time is between 6/1 - 7/1) that are backdated for previous months (including April and May)
View this sample chart in the Amplitude Demo space. If you see a mismatch between event server upload time vs event timestamps displayed in the chart visual above, talk to an engineer to understand why they’re backdating data or why they’re queuing up data for the following month.
Group the data by Library to verify if your engineering team is intentionally using the Batch Event Upload API to import historical data or if an upstream business application source has any relation to this ingested data.
Group the data by Event Name to verify which events are most commonly being backfilled.
⚠️ If Amplitude receives events for unique users in June (server upload time = June) that are backdated for previous months (timestamp = April and May), these users are treated as additional MTUs that are counted in June, the month they are received in.
Step 2: Identify if anonymous users are spiking MTU counts
Let’s review a proxy ratio of anonymous users to identified users in your project(s). Within your project(s)*, build an event segmentation chart with the following syntax
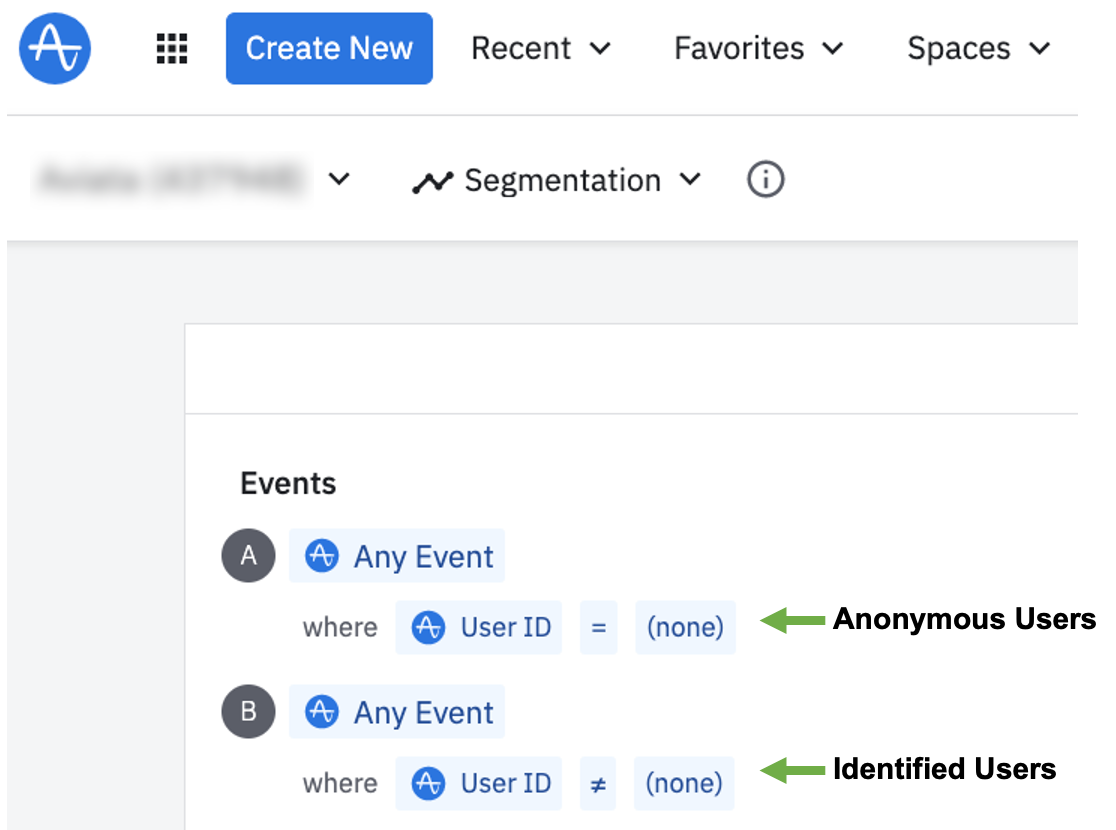
View this sample chart in the Amplitude Demo space. This demo data is too perfect to display any anonymous users.
Next take a look at the ratio of anonymous users to identified users for a specific month and consider Is this a healthy ratio for my product tracking?
-
Set the chart measurement to uniques, as you are calculating the unique users in your product, which is event-total agnostic
-
Set the date range to either
-
Set the chart visual as a bar chart to quickly see the unique user count difference among anonymous vs identified users
ℹ️ Note: this analysis will display a proxy count on how many MTUs your project has ingested for the given month. Since this analysis is limited to unique users who performed tracked events within the project, it does not include separate Identify calls that your project may have ingested from upstream partner integrations, such as Segment. For most accurate MTU counts, please refer to the settings < general tab.
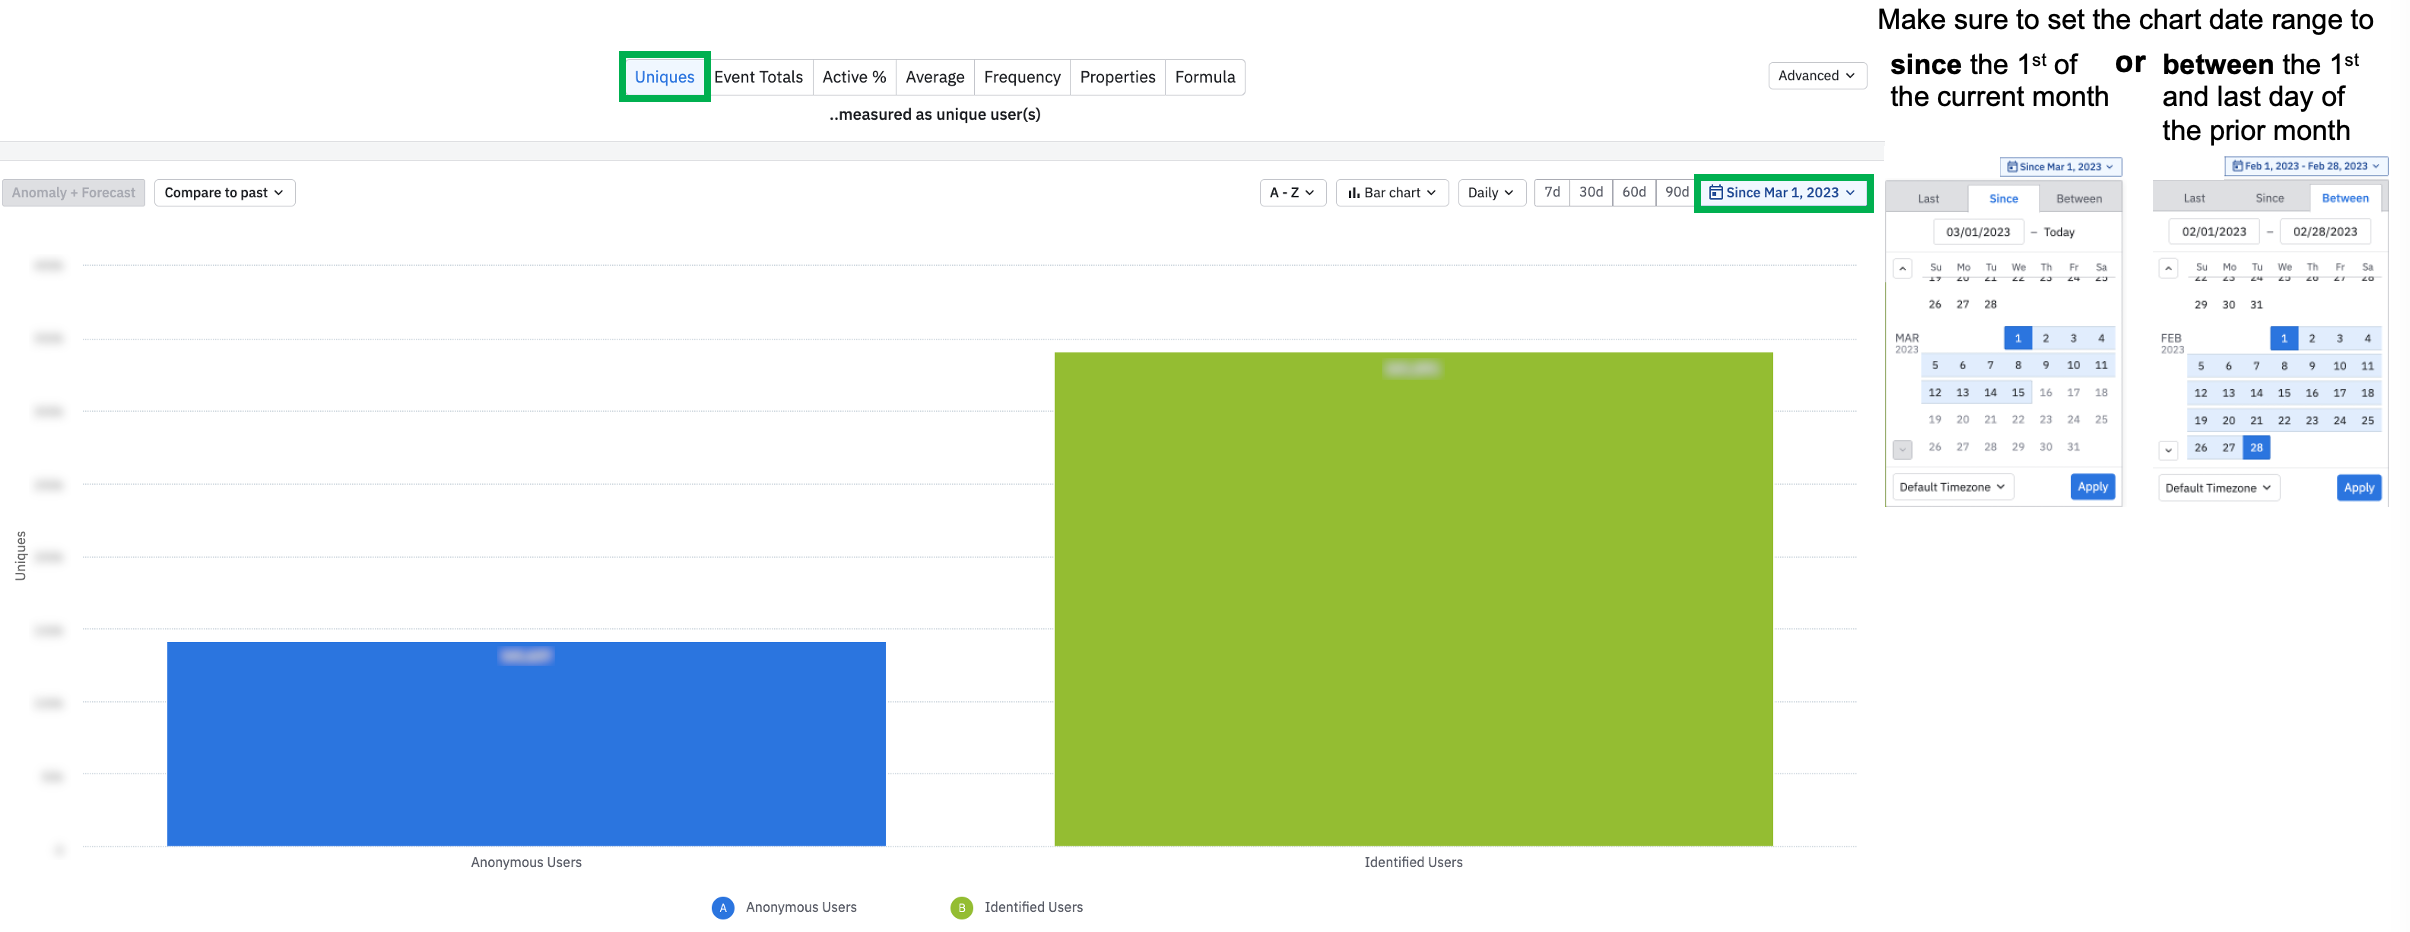
In the example above, identified users are 1.4x more commonly seen in this product’s data than anonymous users.
⚠️ *If you have multiple projects with live data ingestion, you will need to recreate this chart in each project to sum up MTUs across every project. If you have the Portfolio add-on, then you can build a multi-project portfolio to do this analysis at scale. Within the portfolio you can identify which projects are attributing to the highest MTU counts, by grouping on Project ID.
If your product requires a login, then all actions performed in the product post login should be tracked with identified User ID’s.
If your product enables anonymous usage, and eventually requires a login, then Amplitude is able to merge an anonymous user’s Device ID and Amplitude ID with their logged in User ID as long as the user logs in on the same device - read more on merged users here. In this instance the anonymous usage will be merged with the logged-in usage, resulting in a single MTU for the identified user. This instance can result in a reduced MTU count before the month ends.
Continue reading below to identify which events are most commonly triggered by anonymous users and evaluate the criticality of tracking some of those events in your current taxonomy. You can also visit your in-product pricing page to evaluate other plan options for more flexible MTU limits.

Step 3: Analyze the time series of anonymous users triggering events
With the same chart you built in step 1, modify the chart visual from bar chart to a line chart to identify if there were any noticeable spikes or dips in anonymous users over the course of the month, compared to identified users.
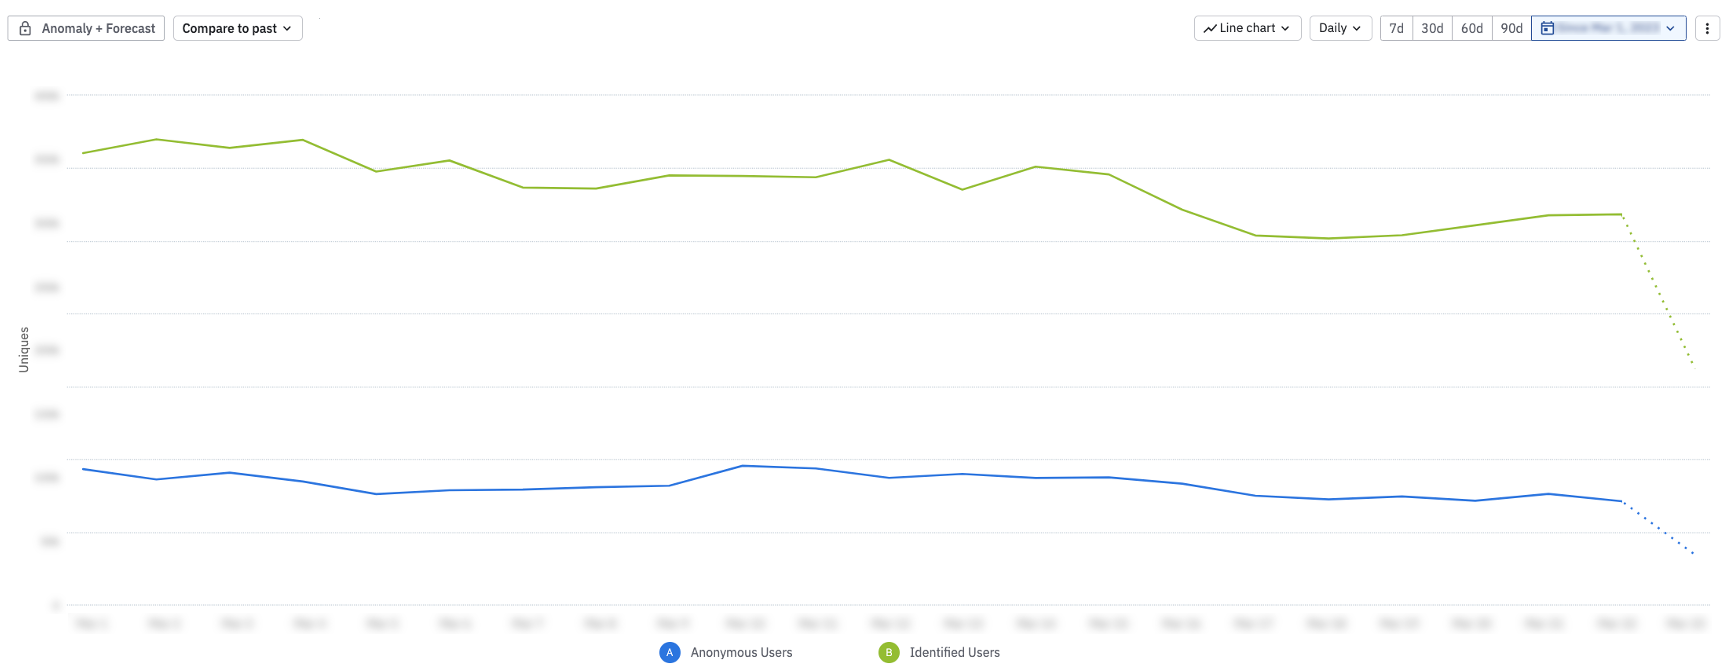
Consistent data trends throughout the monthFor the chart example above, usage data is consistent over the course of the month for these 2 segments.
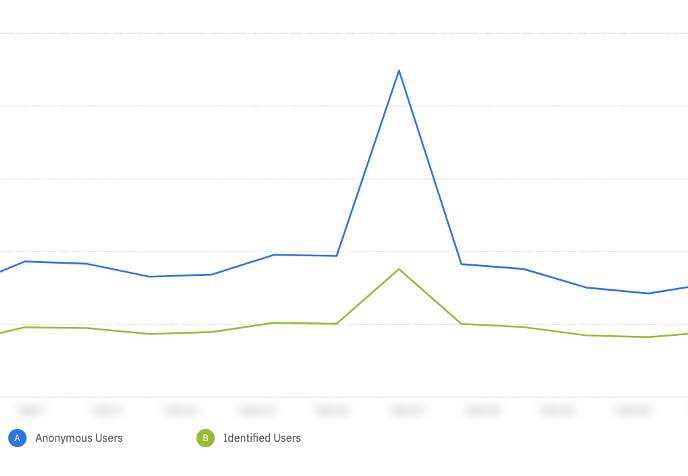
If you see a trend like the graph below, where identified users drop and anonymous users spike on a specific date, immediately flag this anomaly to your product engineers to investigate if a code change resulted in a user identification bug in your product.
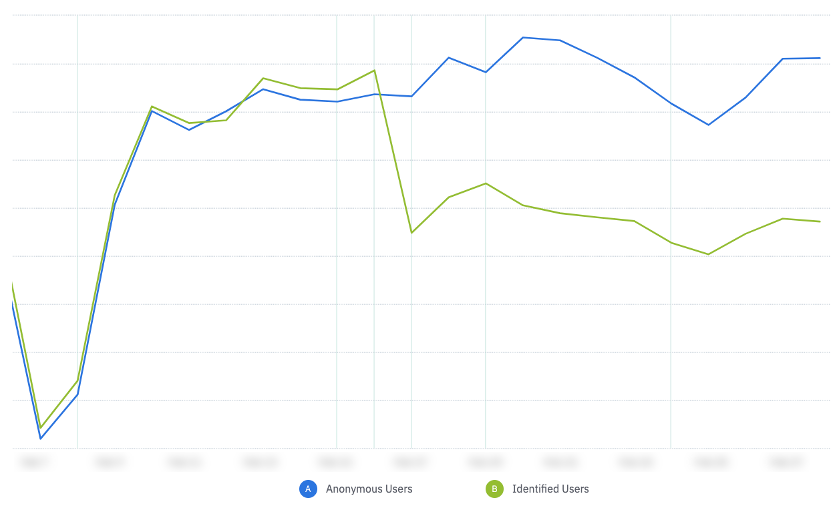
Large drop-off of identified users on same day as spike of anonymous users
If you see a trend like the graph below, this is a consistent spike for both anonymous and identified users on the same day in your product. Consider the following questions in your data investigation:
-
Was there a new feature release in the product that more users adopted on this specific day?
-
Was there a marketing campaign that drove more users to the product on this specific day?
-
Was there a code bug that resulted in more unique anonymous users on this specific day?
Consistent spike for both anonymous and identified users on the same day
If you have access to the Root Cause Analysis beta, then you can quickly run a diagnosis to identify any property values that correlate with the data spikes or drop-offs on a specific day in your chart. If you don’t have this feature, no problem. Try slicing your anonymous users by the following
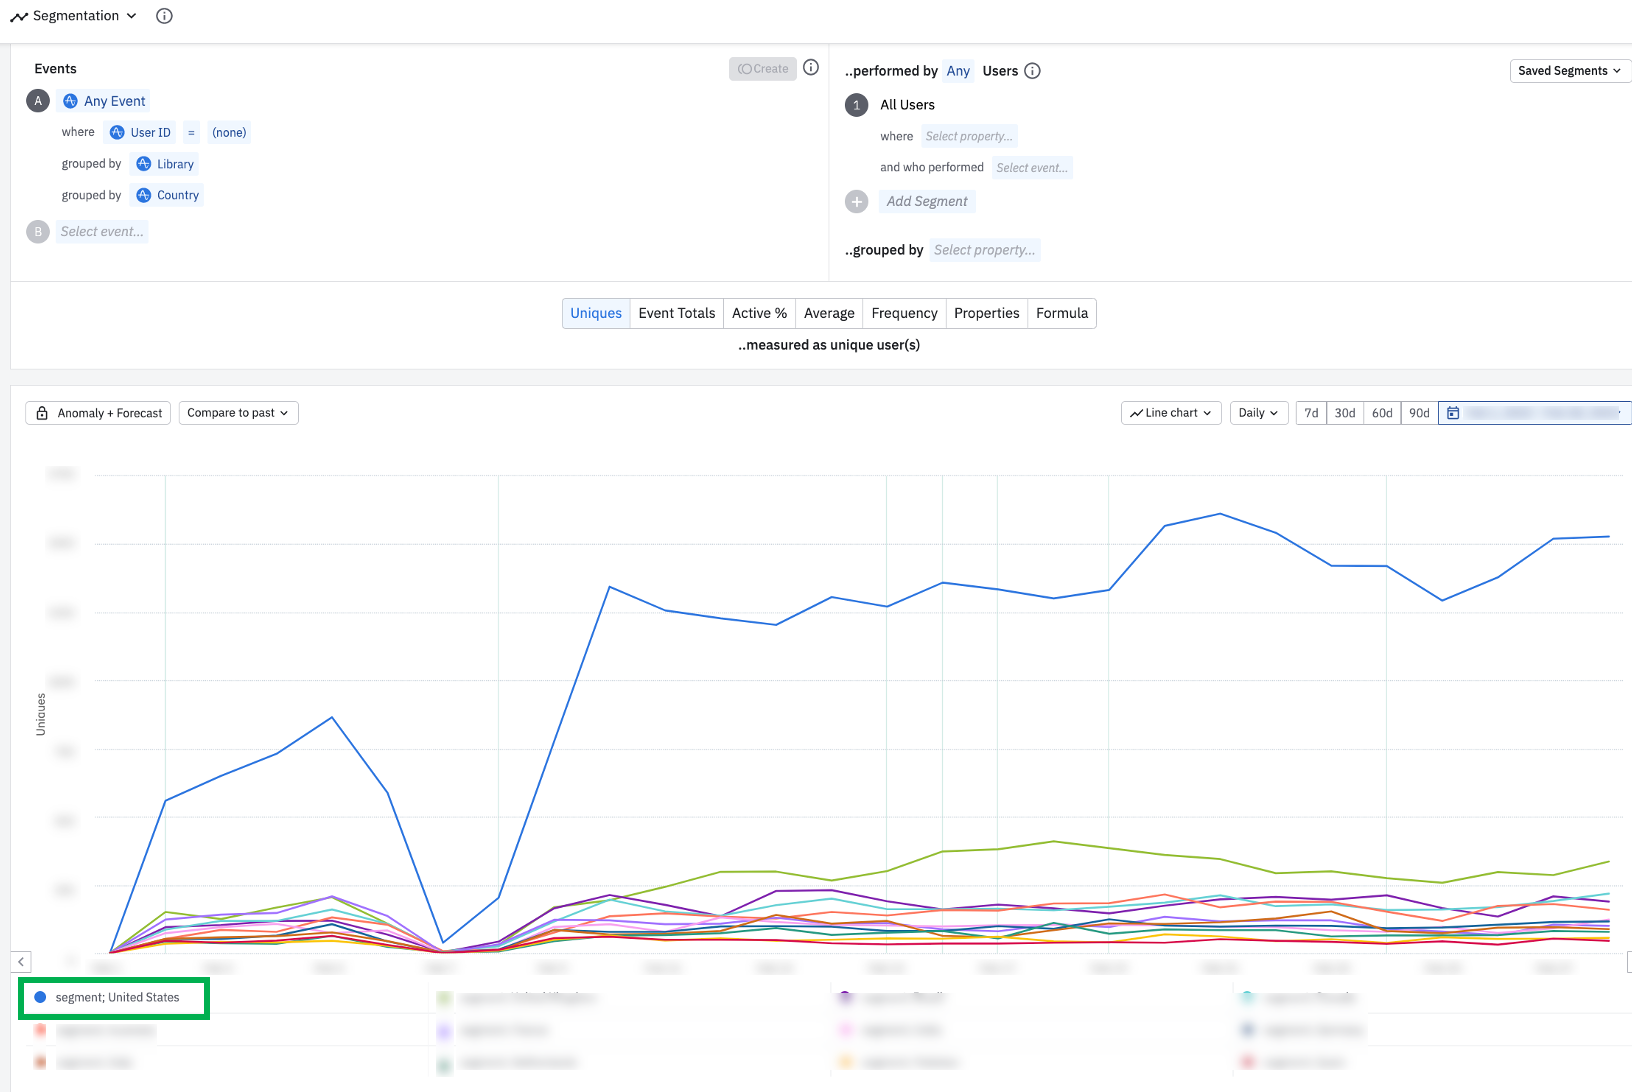
Noticeable data spike among anonymous users events triggered from Segment and in the US
Step 4: Identify which events are most commonly generated by anonymous users
First, limit your analysis by anonymous users, and group Any Event by Event Name.
In this example, anonymous users are only triggering 1 eventAlthough uncommon, in the chart above, there is only 1 event that anonymous users are triggering. For this org, the anonymous user count is driving MTU overages. In order to keep MTU counts down, this org should consider temporarily disabling the code on this event. Setting up a block filter is also a great solution to prevent ingestion on this event moving forward, pending further investigation into any potential user identification leaks. Make sure to read the section below on event cleanup tips to identify active users of this event so you can communicate any taxonomy changes to your broader team.
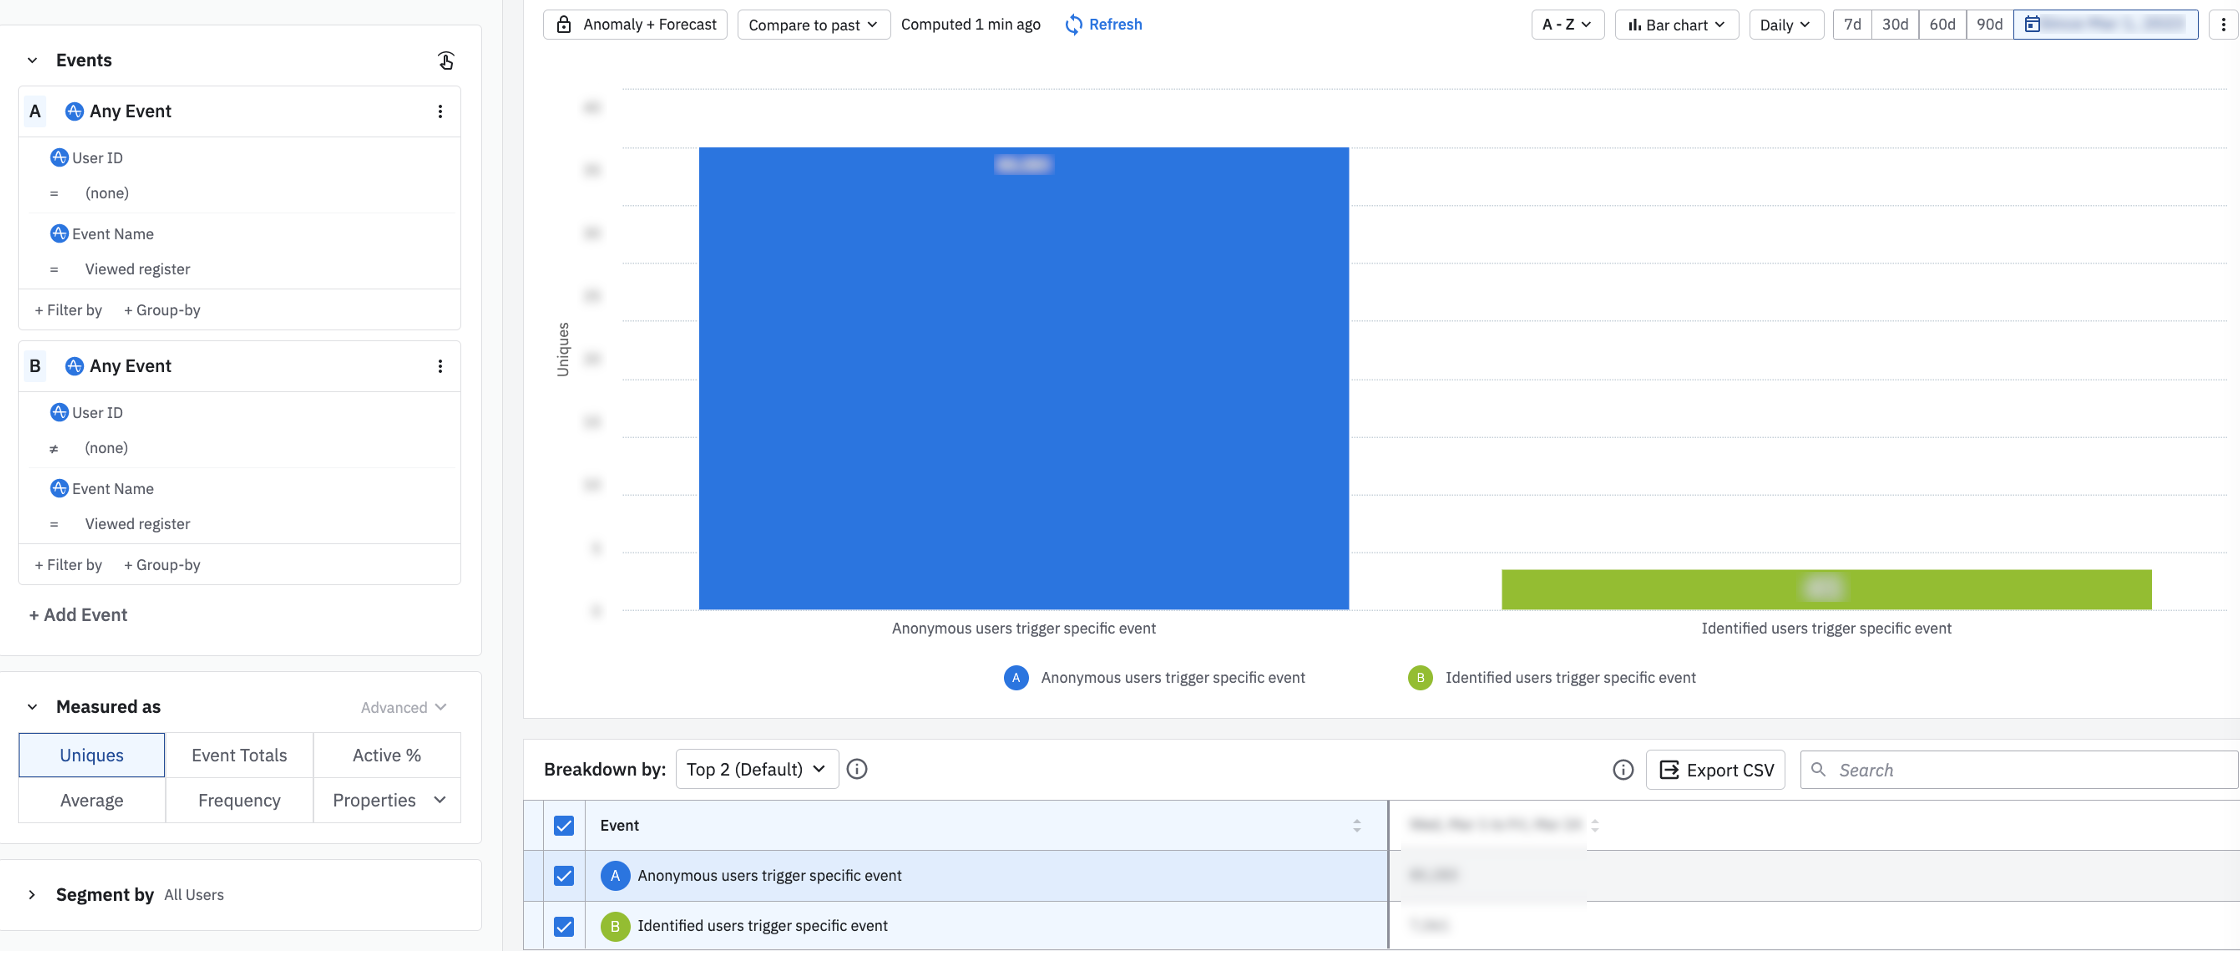
To calculate the distinct count of events anonymous users are triggering, compared to identified users, plug in the formula PROPCOUNT(A); PROPCOUNT(B) into the first chart setup. View more on formulas.
As highlighted below, anonymous users are only triggering 1 distinct event type, compared to identified users triggering >50 event types.
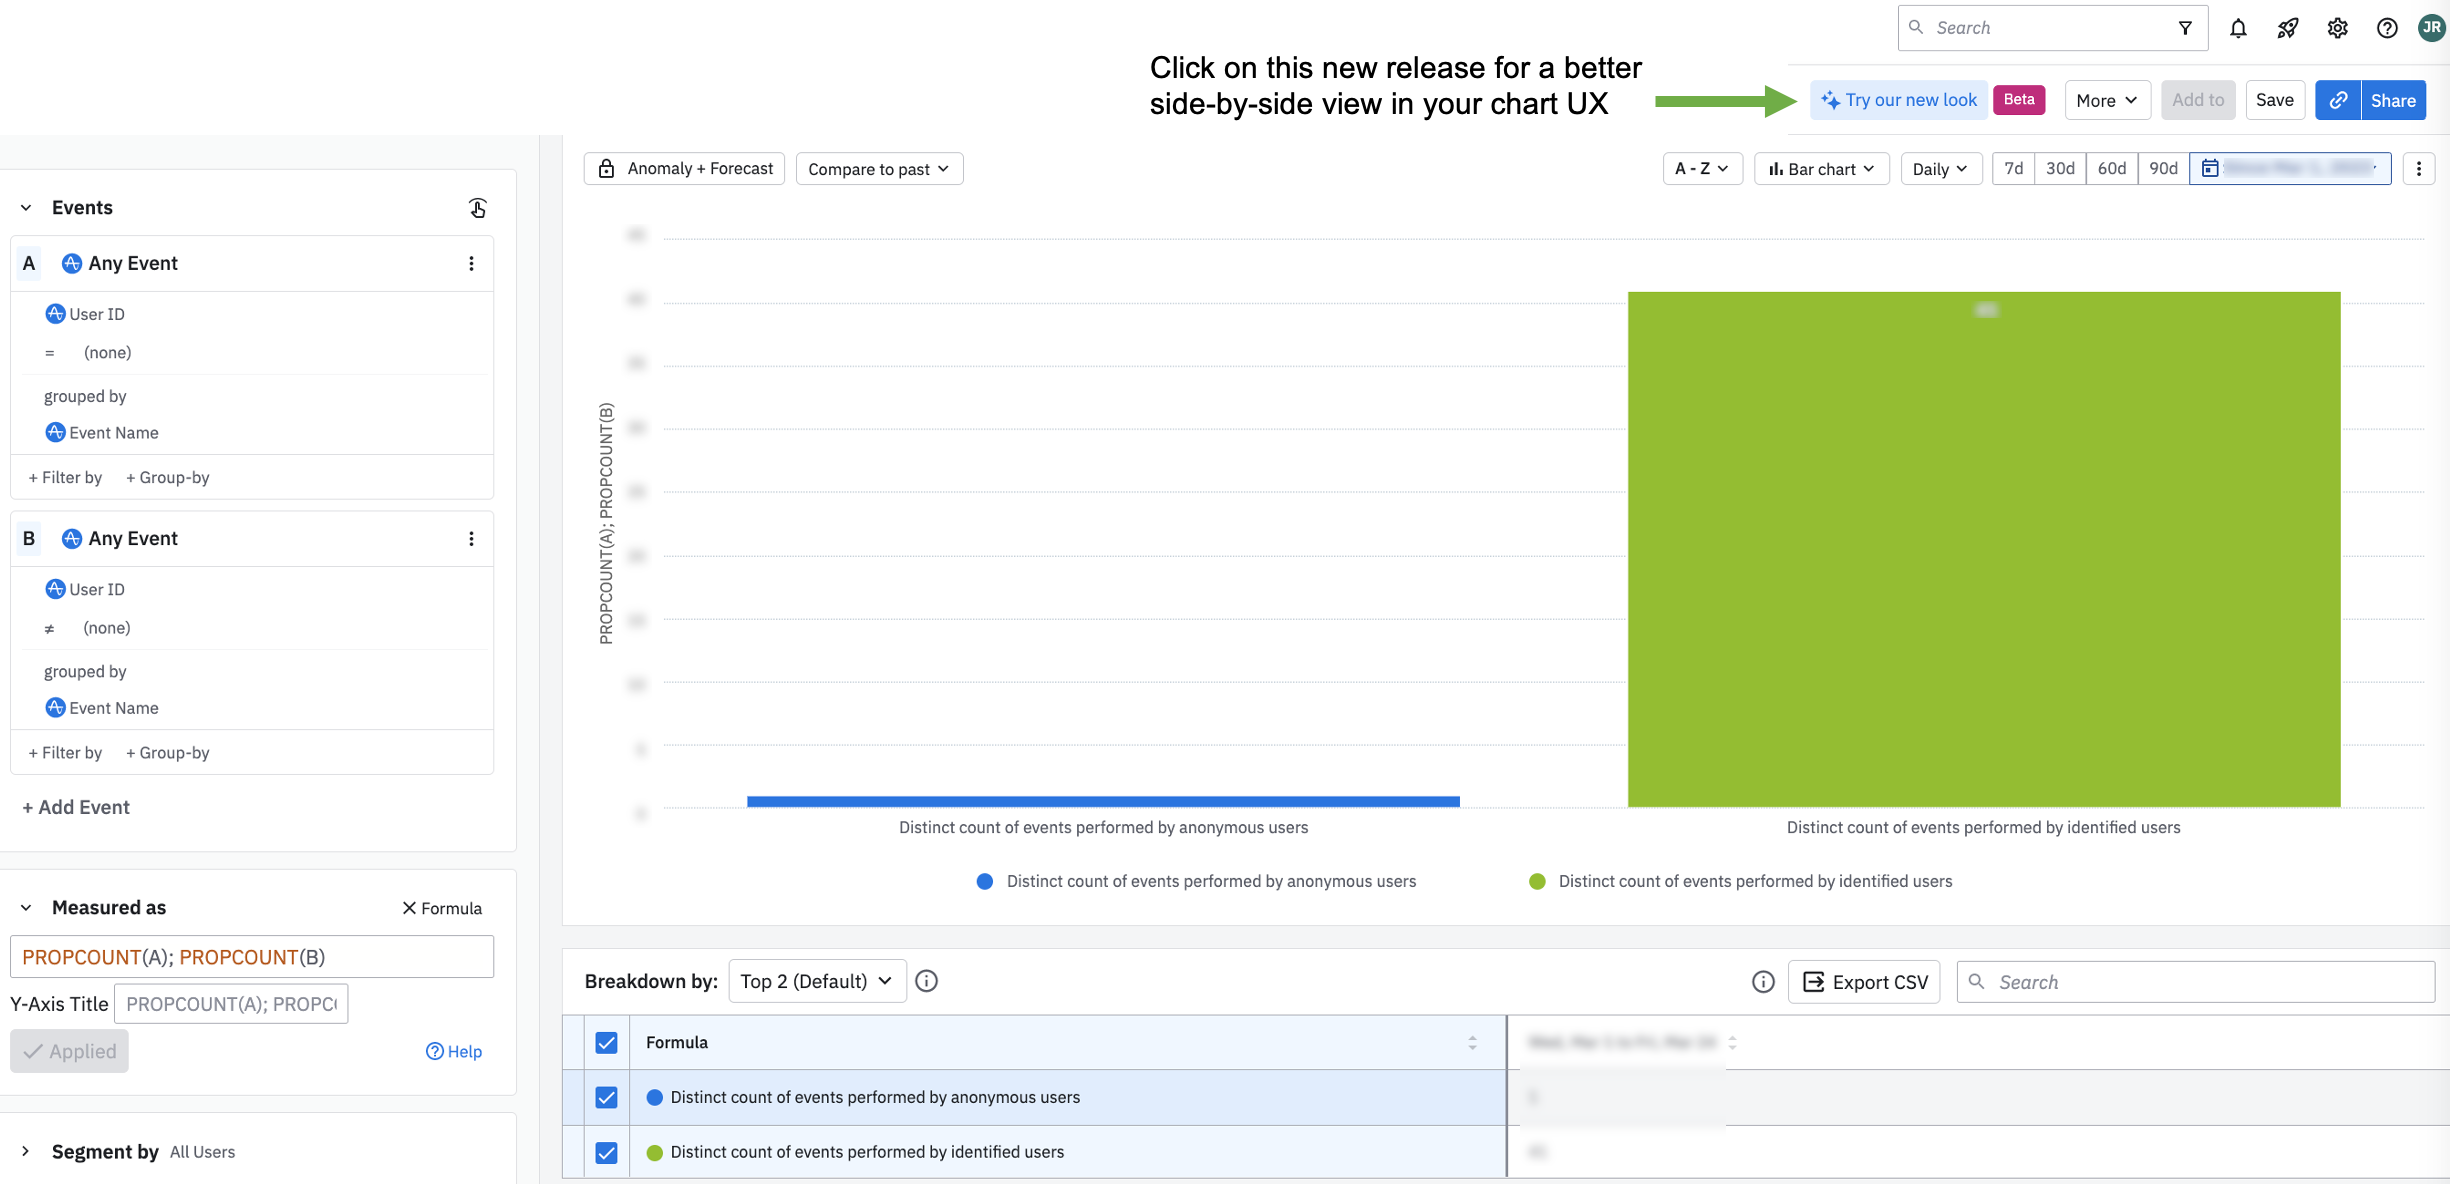
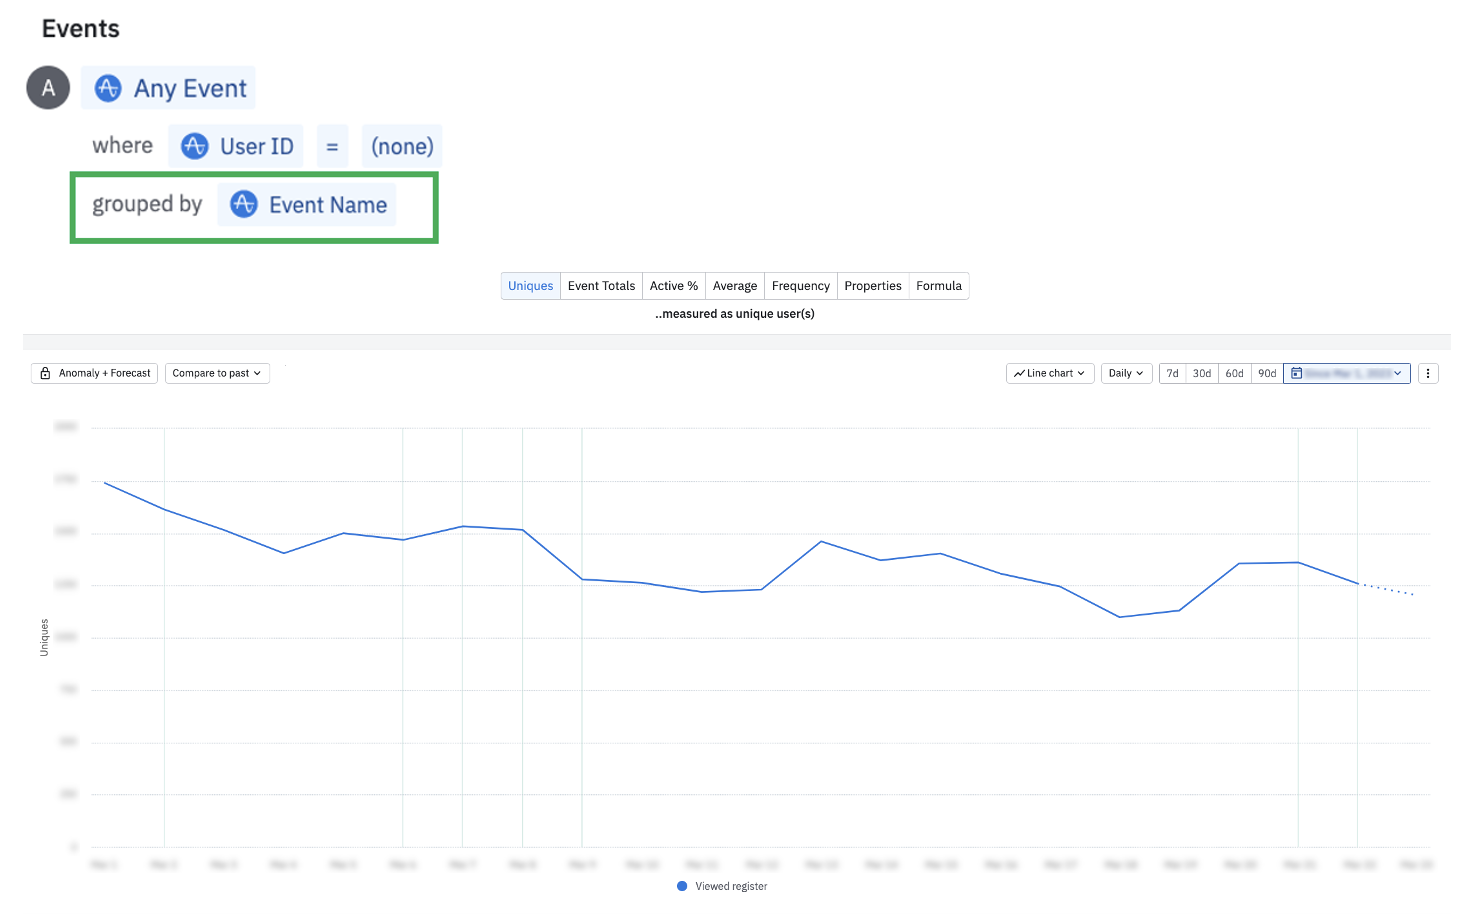
Chart Tip: This chart displays the new UX design for a digestible side-by-side view of the event segmentation alongside the chart visual. This consolidates more information into 1 clean screenshot for this article.If you switch the formula back to Uniques and adjust the segmentation to where Event Name = the key event anonymous users are performing, you can see the ratio between anonymous users triggering the event, compared to identified users. In this example, Event Name = Viewed register. Check with an engineer to verify if this is expected behavior to have a 10:1 ratio of anonymous users triggering this event.
There is ~10:1 ratio of anonymous users triggering this single event, compared to identified usersPerhaps more realistically, your product data looks like the chart below, where anonymous users are triggering multiple events. The most commonly triggered anonymous events relate to signups and attempted login clicks, right before the user’s login ID is collected.
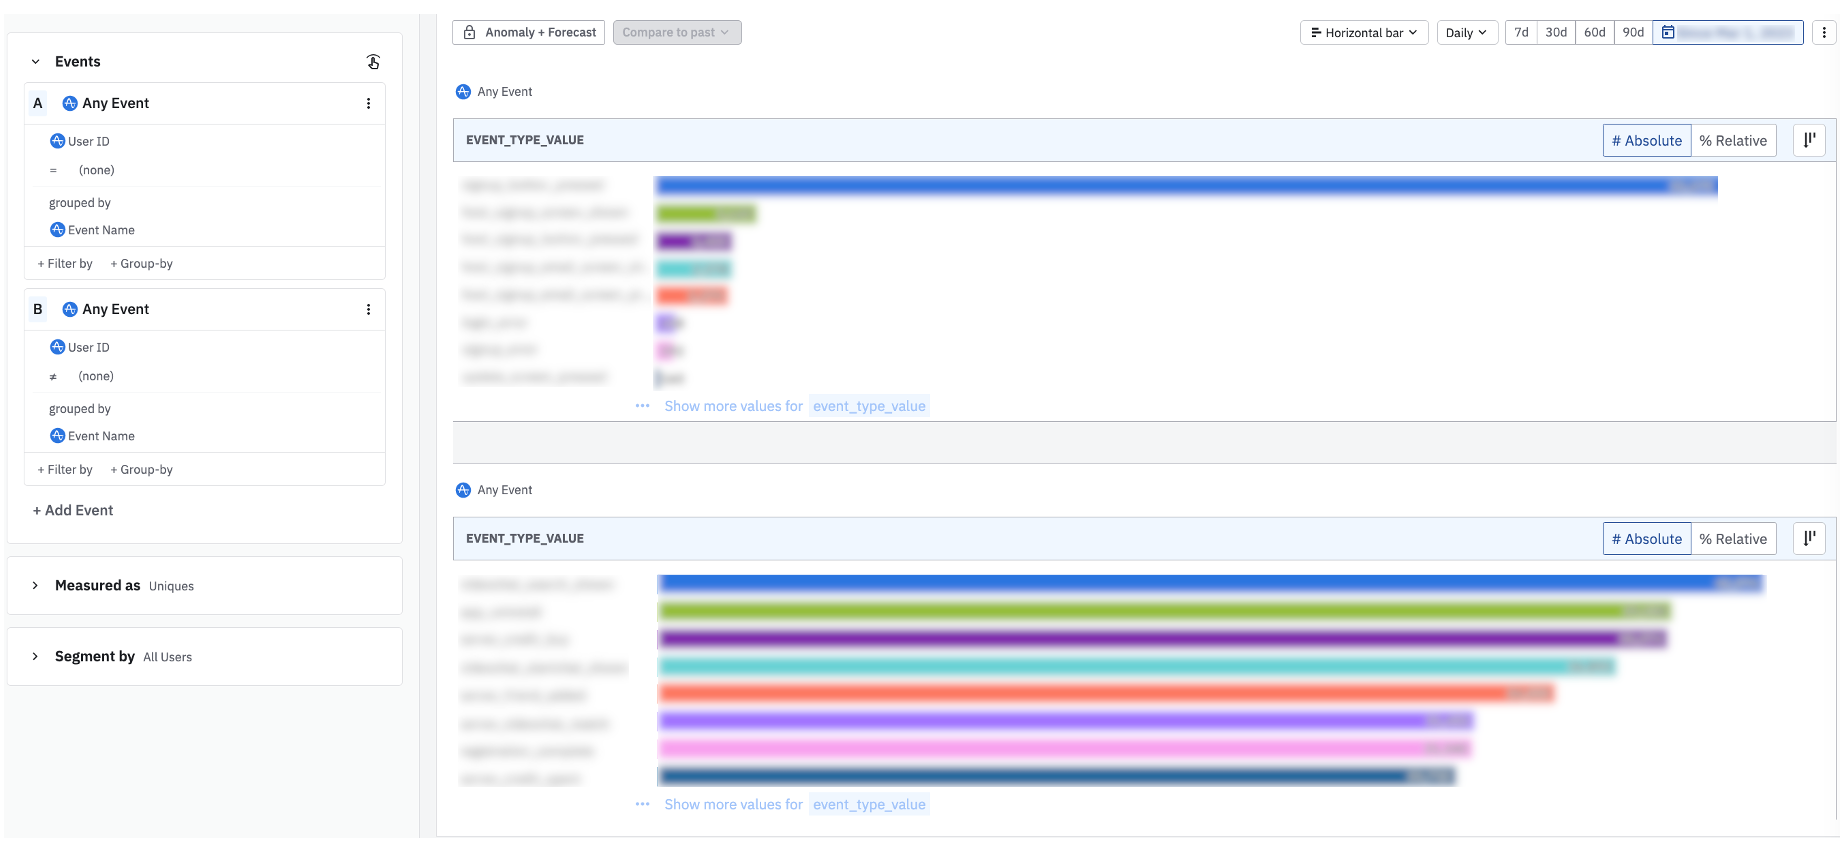
This horizontal bar chart displays the breakdown of events triggered from each user groupIf there’s a large count variance between attempted signups and authenticated users who login to the product, you may want to investigate any errors users may be hitting in the signup flow. If you’re suspecting a large number of bots triggering your events, you may want to route your data through a proxy server before sending it into Amplitude. Documentation on setting up a proxy service can be found here.
Step 5: Verify if any projects have been deleted
Project deletion and data deletion do not reverse nor reduce previously ingested MTU counts. If a project has been deleted in your org, all admins will receive an email with the details below
- From sender: Amplitude <noreply@amplitude.com>
- Subject line: [Project Name] (project ID) has been successfully deleted
- Body: includes who deleted the project
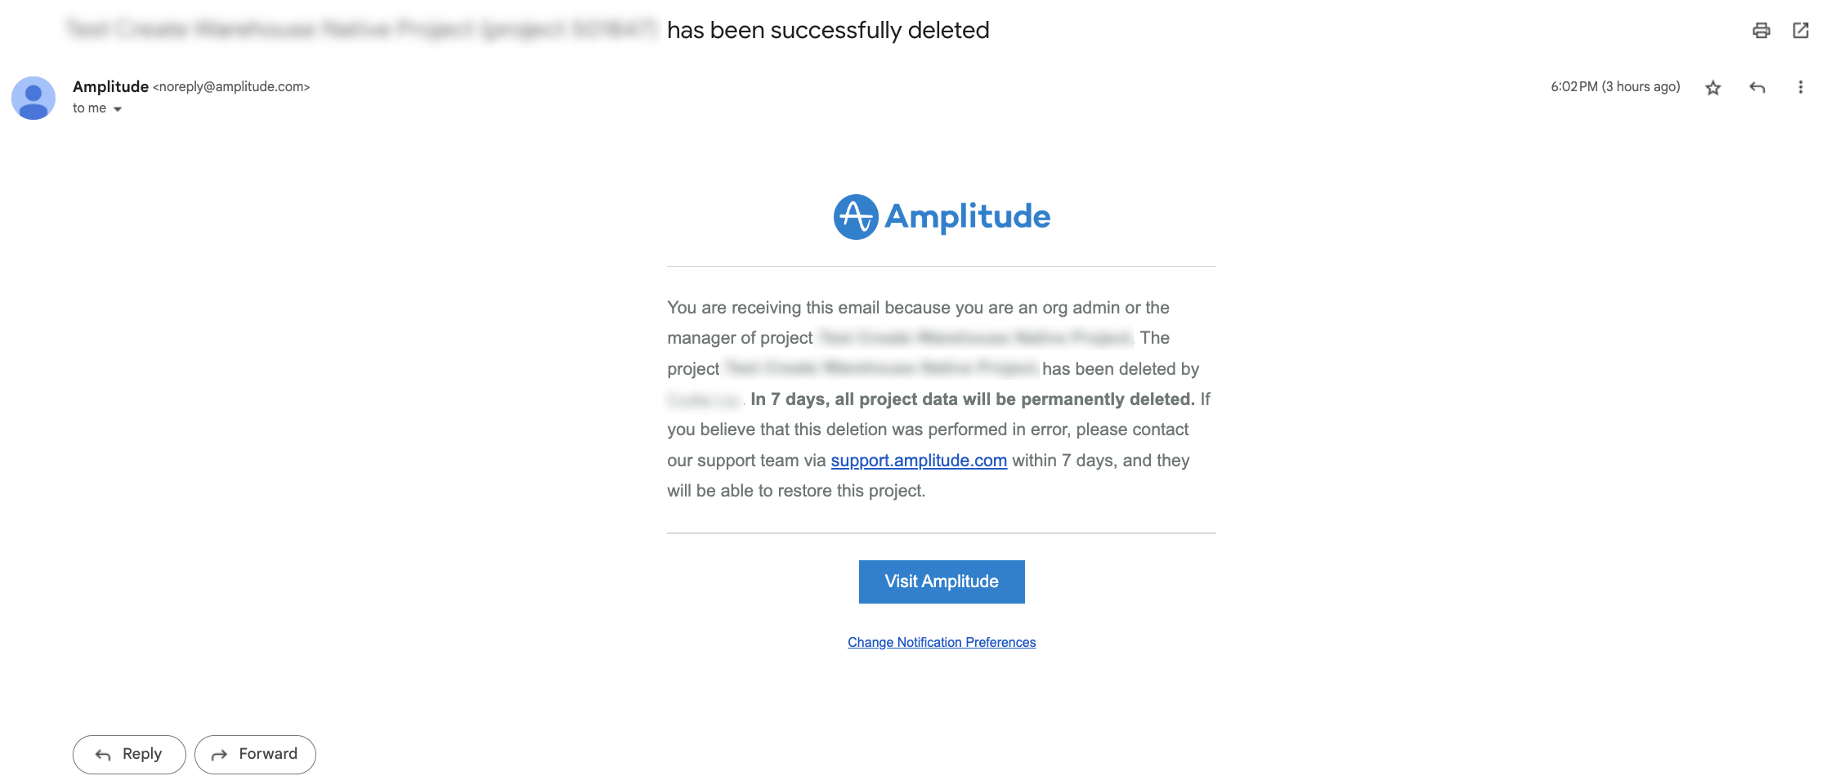 Email sent to org admins upon project deletion
Check your inbox or ask an admin if they’ve received this email recently. Not sure which users are admins in your org? Navigate to your org settings < members and filter on role = admin.
Event cleanup tips to reduce MTUs
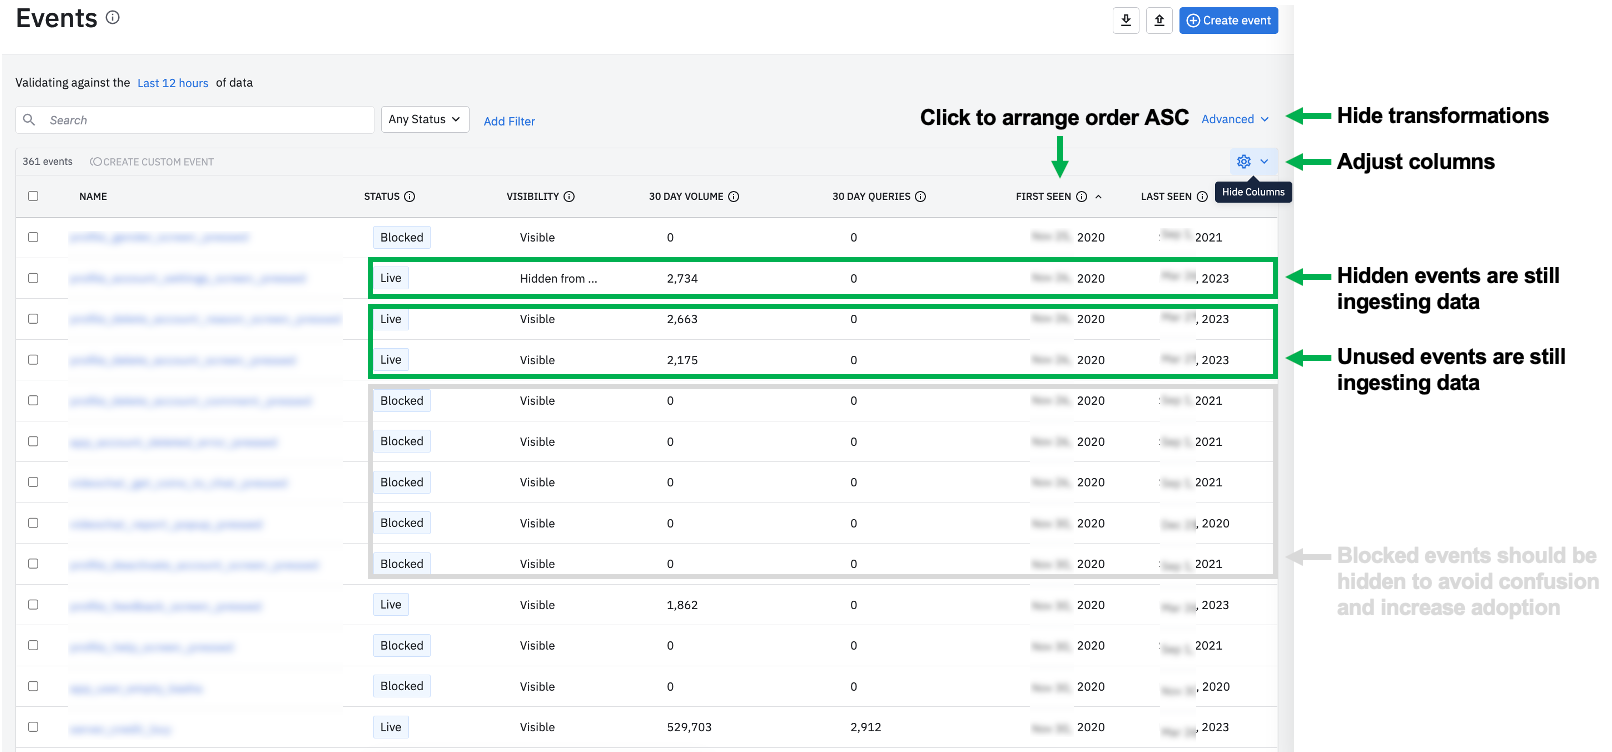
Before you setup any block filters on events, verify if other team members are querying them to communicate accordingly of any impending taxonomy changes. Navigate to the Data product and run through the following steps.
-
In the Data product, navigate to the events tab
-
Click on the tooling emoji to add / collapse columns in your view
-
Add in “30 Day Volume”, “30 Day Queries”, and “First Seen” columns
-
Keep “Status”, “Visibility”, and “Last Seen” columns
-
Click the “First Seen” column twice to arrange the order in ASC (oldest events first)
-
If you have many custom events that are causing confusion in this analysis, click “Advanced” to temporarily hide transformations
Take a look at the events in your project(s) and inspect the following cases
-
Are there any high volume events with 0 recent queries? If yes, consider if these events are still critical to your org. If they’re no longer critical to track, consider setting up a block filter to block this data moving forward. Block filters reduce future ingestion which can reduce MTUs moving forward
-
Reminder: Click on the event to verify if there were any historical charts, cohorts, or custom events that referenced the event before you block this data, to communicate accordingly to key stakeholders of any upcoming taxonomy changes.
-
Are there any hidden events? If yes, consider why is your org still ingesting data on these events? It may be time to evaluate if any hidden events should be deleted or blocked. This may reduce some MTUs.
-
Filter on the keyword “test” to identify any noticeable event names that seem outdated for testing. Make sure your engineers aren’t testing in production project(s), and try to ensure testing is limited to a few user IDs for negligible impact on MTUs.
-
Are there any outdated sources connected to your Amplitude project(s) in Data? If the data from this source is no longer relevant for your team needs, consider removing the connection to that upstream source to stop data ingestion from that source. This will stop future data ingestion from the source connector which can reduce MTUs moving forward
Additional event cleanup tips that will not impact MTUs
-
Are there any blocked events that are still visible? Clean, digestible and relevant data in your project(s) increases Amplitude usage. Consider hiding or deleting blocked events to reduce old taxonomy noise.
-
Are there any Live / Visible events that were first seen back in 2020 but last seen in 2021? If the data is no longer relevant, consider the following
-
a) can these older events be merged with newer events that may have replaced the tracking
-
b) if these are still critical to maintain for historical analyses, be sure to add a clear event description to indicate ingestion stopped in 2021
-
c) if these events are no longer critical, consider hiding or deleting the event
-
Are there any noticeable duplicate events that should be consolidated / merged?
🔜 Coming soon… Amplitude engineers are working to rollout a new MTU project tracker within the settings < projects tab. We’ll update this post when it’s released.
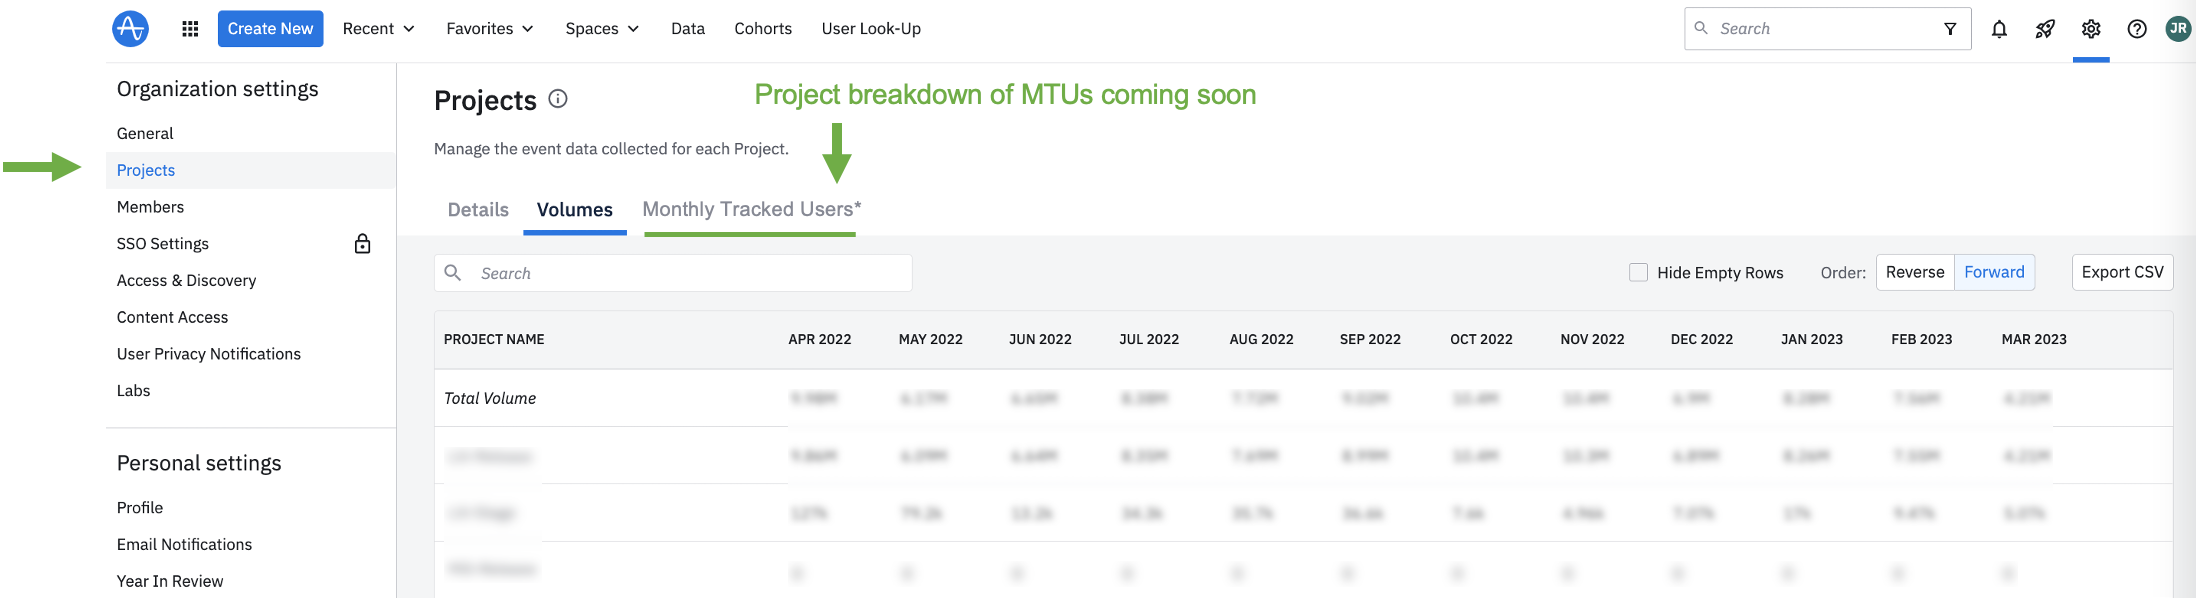 Coming soon