If you go to create a Metric, you can select the Property Average metric type, then plug in your event and the duration property you mentioned and you should be good. Note that your duration property will need to be integer.
Alternatively, do you have two events to measure the completion time between, or is it just a single event you capture with the lapsed time as a property? If you have two events, you can just create a Funnel with Event 1 > Event 2….in the table below the funnel you’ll see that you’re provided with “average time between”. You can also then change the funnel to show “time to convert” and you’ll get the distribution.
Hope this helps!
Hi Lucy!
If all you need is to get the property tracked average for that one event, there might be a few options. I will list them below and include the chart links to the Amplitude demo account!
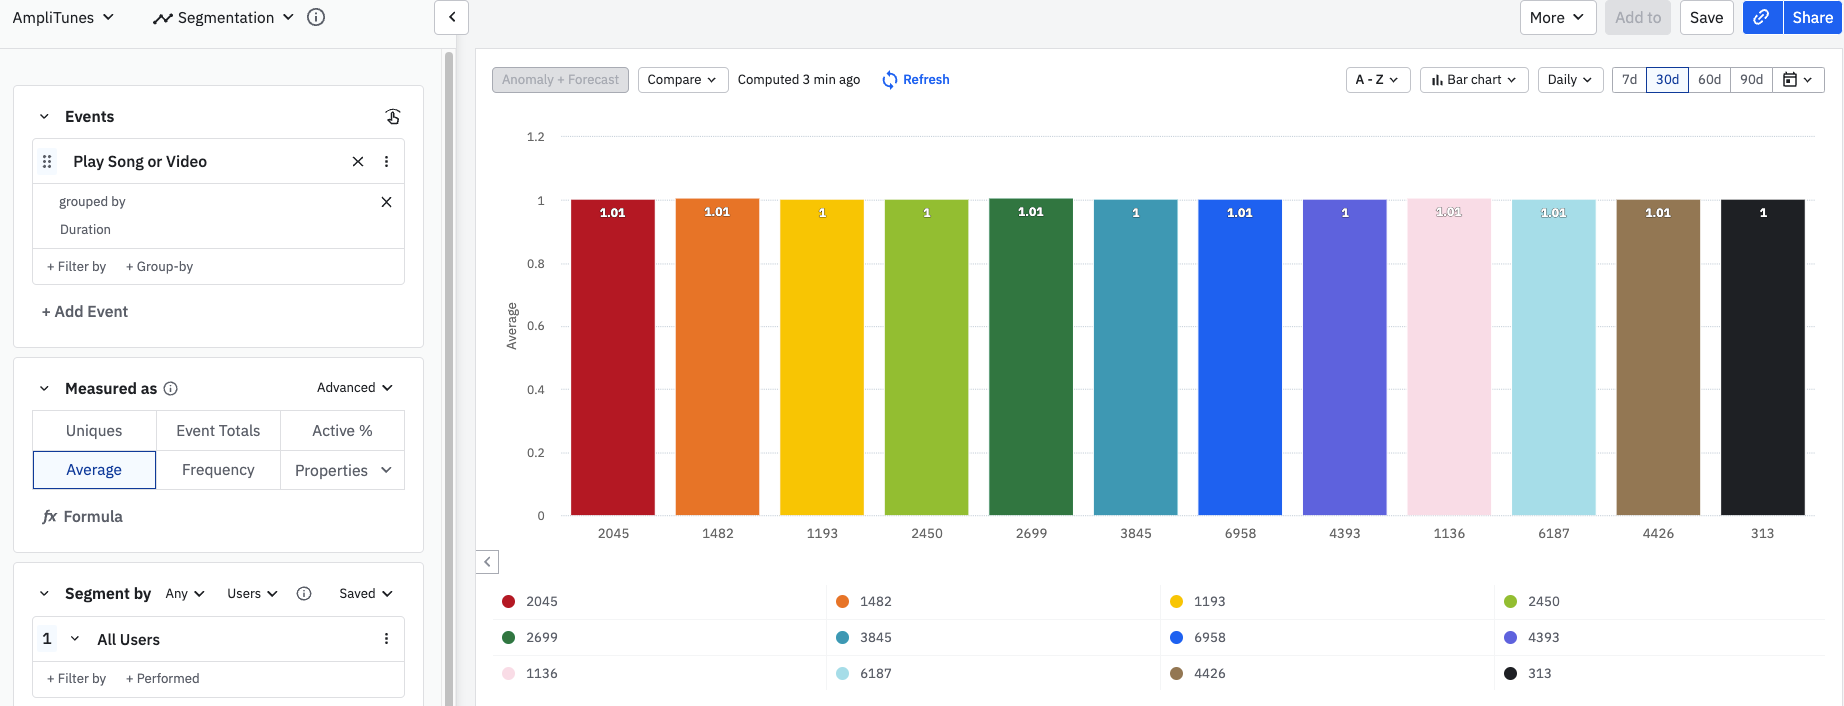
Average: using the group by function, you could create a chart that counts the average number of users who triggered the event by the seconds duration. I am not sure that this is what would solve what you are looking for particularly but could give you additional context https://analytics.amplitude.com/demo/chart/new/kwo2vipi
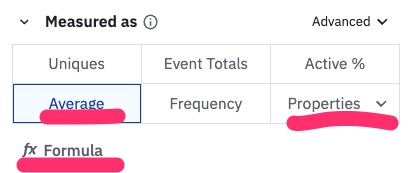
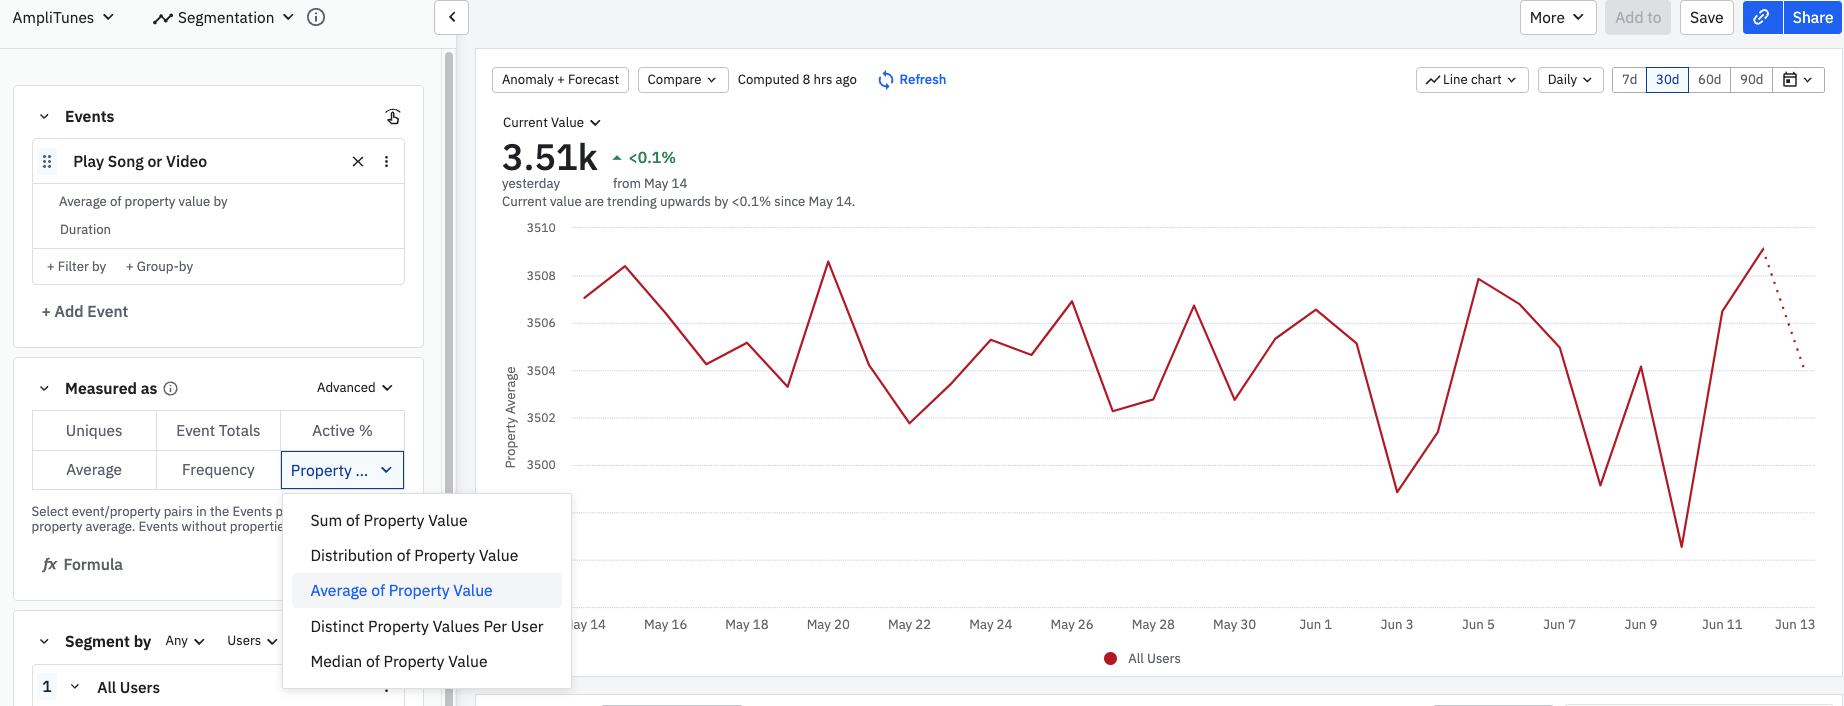
Properties: using the group by function of a numerical value (in your case, seconds), you could select the average of property value, however, this is going to give you the average for all the users, not per user https://analytics.amplitude.com/demo/chart/new/l2suey22
If you don’t have a lot of users, you might be able to use a data table where you can add your metric (Dan shared a link to metrics FAQ) and group by user ID but, again, that is only if you have a small number of users. If it’s pruned, you could create segments instead where you group certain users and analyze their averages that way.
Hope this helps!
Thank you! I totally missed that “Average of Property Value” option.
If you don't have an Amplitude account, you can create an Amplitude Starter account for free and enjoy direct access to the Community via SSO. Create an Amplitude account. You can also create a Guest account below!
If you're a current customer, select the domain you use to sign in with Amplitude.
If you don't have an Amplitude account, you can create an Amplitude Starter account for free and enjoy direct access to the Community via SSO. Create an Amplitude account. Want to sign up as a guest? Create a Community account.
If you're a current customer, select the domain you use to sign in with Amplitude.