Is array of objects possible in UserProperties? Does Amplitude charts allow insights on the key inside array objects ?
I have a device on which I connect 3 USB Cameras named : Front, Left, Right. There will be definately be charts based on the event_type and event_properties.
But, here I am interested in charts that I can create from User Properties. The User(or device) Properties in any event, may have attached usb array object as below :
Is this event structure possible and useful to create below charts? If not , What can be done differently in event structure for below charts?
Can I create chart say showing distribution of vendors of all camera plugged into across devices and see camera-only vs other peripheral ? Can I create a chart showing growth of a particular or top 5 camera vendors over time ?
Page 1 / 1
Hi @vjbhakta ! Welcome to the Community and I’m happy to help!
While it is the case that Amplitude can extrapolate nested objects, Amplitude does not really support array of objects and therefore the structure of array of objects is not going to be useful to create charts. If you sent an array of objects like the example you shared, Amplitude will stringify the array of objects. Since it becomes a string, you will not be able to really query on the individual object and therefore will not be able to simply pull the vendor values.
As such, what can be done differently in event structure in order to be able to create the chart scenarios that you provided is to separate out the arrays. What I mean by this is sending something like
When you send the above under the user_properties field, you can then do a group by on usbPeripherals_vendor which will break down the individual values.
Hope this helps! Let me know if you have any questions.
Agree with Belinda here.
Sending those values in an array as she pointed out is an easier approach for charting purposes, especially when doing a group by.
Also, if you have a single nested json object property, you can try leveraging the EXTRACT_FROM_DICT function in the derived properties feature to create properties on the fly based on a specific key value if that appears useful.
In that case, how would I corelate which type of Peripheral (Camera-only or Camera+microphone) it is and from which vendor ? say how to create a pie-chart of vendors or models which are camera-only ? or say pie-chart for models from same vendor and see most popular model from same vendor ?
Does amplitude lists such property in dropdown e.g. front_camera.vendor or front_camera.model ?
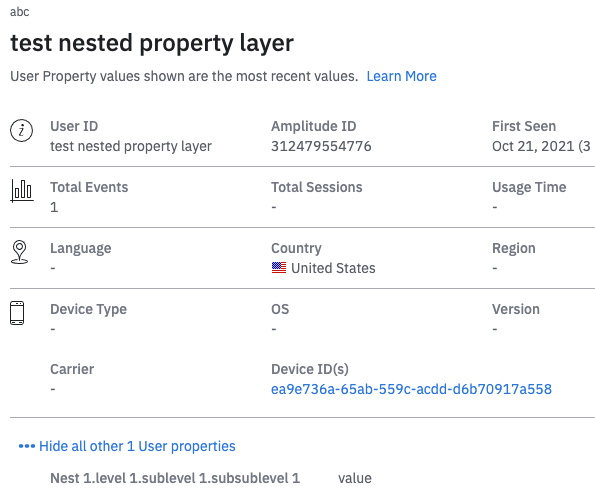
@vjbhakta Based on your use case, I think nested property objects would help achieve intended charts! Nested property is possible - just not nested arrays. And yes, Amplitude will be able to extrapolate nested property objects into e.g. front_camera.vendor or front_camera.model,
By the way, I noticed the camera properties are not under event_properties. Please make sure you add the properties under event_properties as firmware_version, left_camera, etc are not valid top-level fields.
@belinda.chiu Thanks for your input. I will try out something with this notation. In event-properties , camera in action (turned-on, turned-off) will be mentioned e.g. camera_name (left, right, front) . but the details of the camera(s) attached to device will be in device properties as per my understanding.
One further question: what level of depth is supported for nested properties ?
But if you are sending this data through some sort of integration that would help you rearrange the “device properties" as event properties or user properties then do ignore my statement!
For the depth of the nested properties, I don’t think there’s a limit. But please note that we will extrapolate accordingly:
Thanks @belinda.chiu . I am trying out with nested structure .
Two questions:
as immediate bottleneck , I am not able to see the custom properties in Amplitude. Am I missing anything in API call etc. to add custom properties in the event?
Any clues, on what kind of chart to pick and what to follow to aggregate all camera count from all devices and then pie-chart to see distribution of vendors and models ?
Thanks @belinda.chiu
My Bad … I did not notice in your example the custom properties should be nested under “user_properties”. With that correction, I am able to see custom properties in the charts.
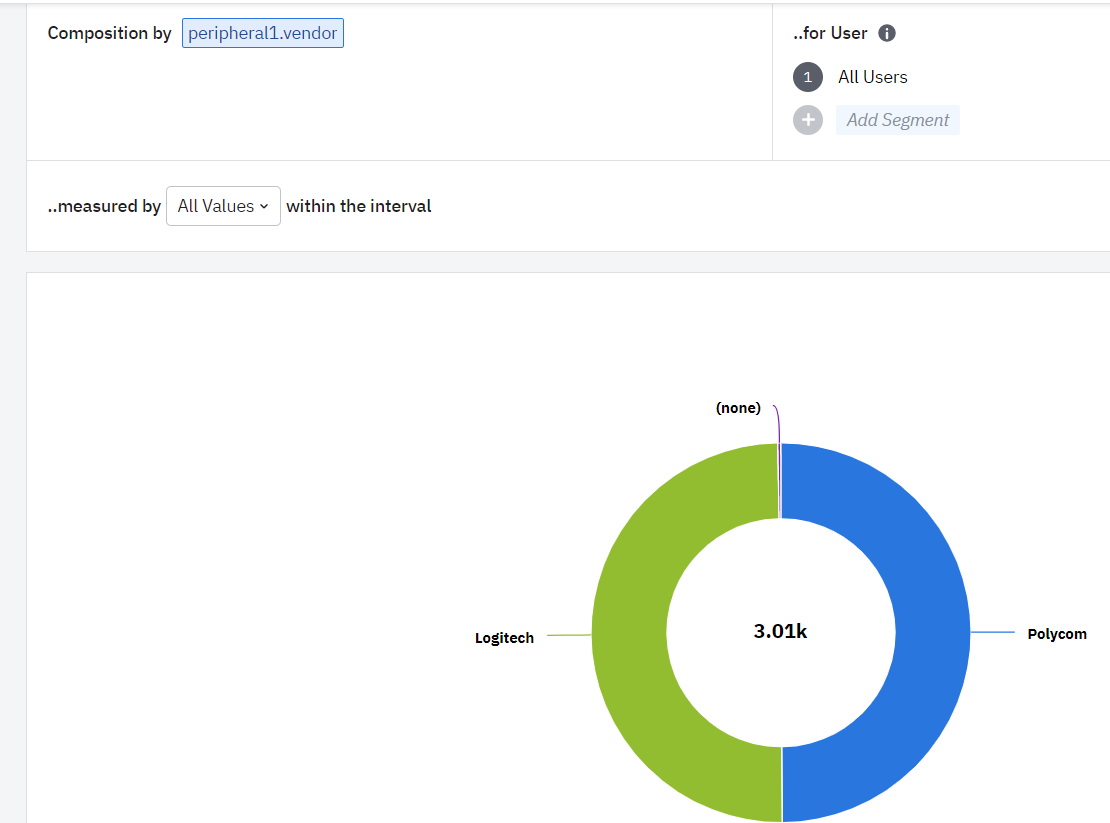
Now, using UserComposition chart type, I am able to create Pie chart selecting one user property say left_camera.vendor. Looks cool !!!
The next challenge is aggregating values from front_camera.vendor + left_camera.vendor + right_camera.vendor and then create Pie chart of it. How can I make it possible ? then moreover putting conditions where cameraCapable=true
Any help or clues for this?
@vjbhakta Glad you were able to make the nested properties work and build a chart!
As for your next challenge, I’ll be very honest in that given what you mentioned now to me, I don’t think Amplitude is the best product to get the visualization you are looking for. While yes it is somewhat possible, it honestly sounds like using something like Pivot tables and creating a Pie chart from that makes more sense.
But in any case, the User Composition chart does only allow you to composite one property. If you want to look at a combination of properties, maybe you can use Event Segmentation instead and group by all the vendors. On the ES chart, you can then also add a where clause for where cameraCapable=true. There is no pie chart visualization on ES chart but you can do a bar chart view which makes things a bit easier.
If you don't have an Amplitude account, you can create an Amplitude Starter account for free and enjoy direct access to the Community via SSO. Create an Amplitude account. You can also create a Guest account below!
If you're a current customer, select the domain you use to sign in with Amplitude.
If you don't have an Amplitude account, you can create an Amplitude Starter account for free and enjoy direct access to the Community via SSO. Create an Amplitude account. Want to sign up as a guest? Create a Community account.
If you're a current customer, select the domain you use to sign in with Amplitude.