Solved

Inactive users who return

  • 23 February 2022
  • 3 replies
  • 513 views

Badge

We are using Amplitude to measure the Retention, in general terms, of our service. As an ecommerce, we are interested in the specific event of add to wishlist.

Our idea is to separate our current user base of total users in this buckets:

  • Weekly Active (users who did add to wishlist event in the last 7 days)
  • Inactive (users who created accout but had never done add to wishlist)

For Inactive we want to measure the rate of “resurrection” (weekly). So we need to calculate the total amount of users in that state and get how many got back each week. 

I have not been able to found a way to do this so far. I haven’t found a way to show what is the total number of users in this state and the weekly amount of “resurrected”.


What I’ve tried but didn’t work:

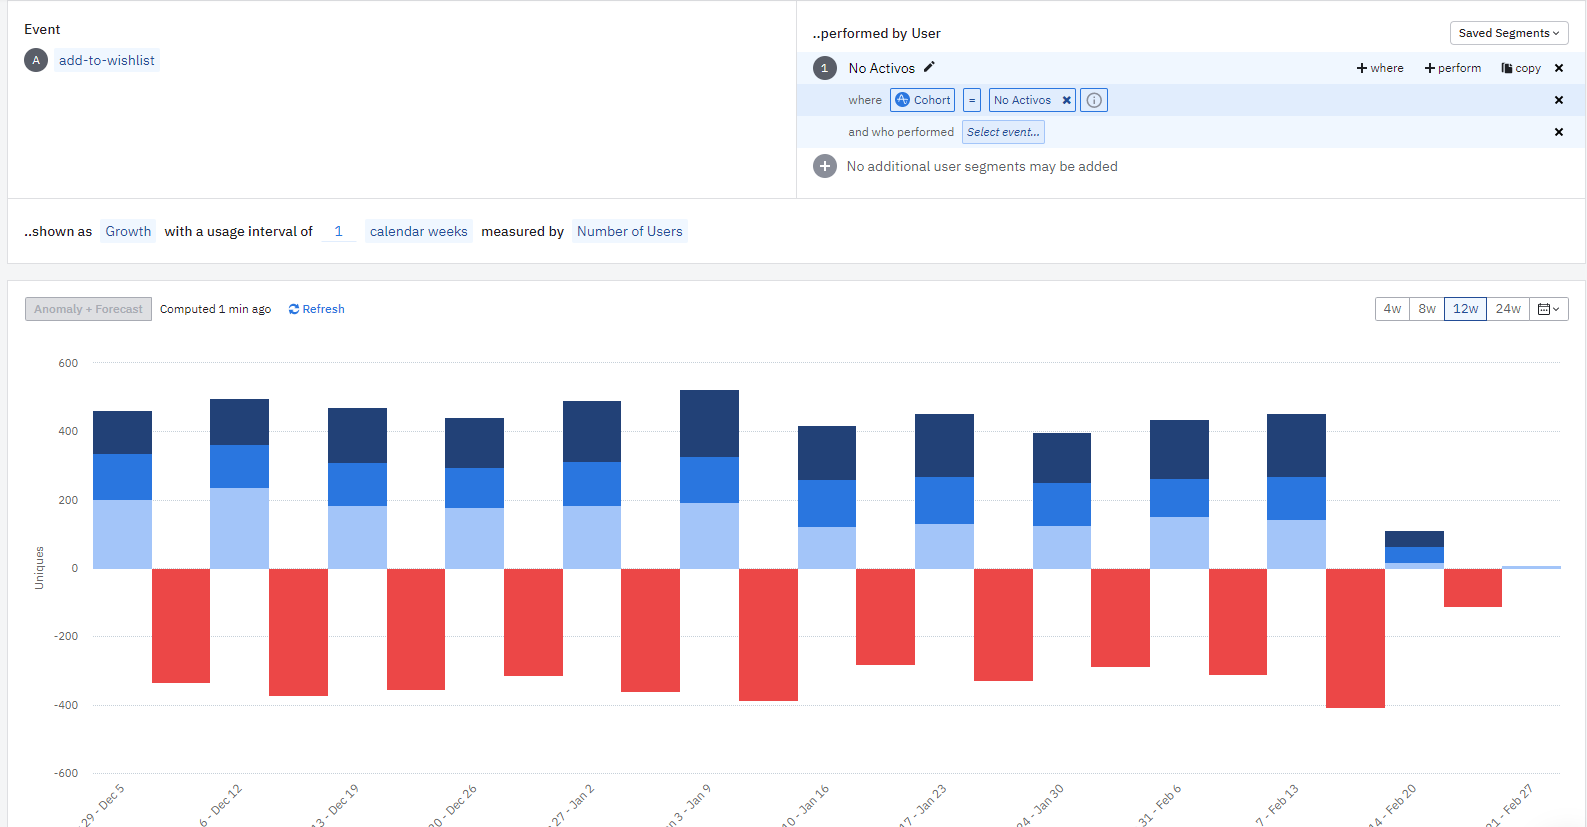
  • Using a Lifecycle graph. The numbers do not match to what we expect. For example, if I get the Weekly Active Users (from Amplitude) and multiply that for the retention rate weekly (also from Amplitude), I should get how many of these users are moving to the next week on that specific action. That does not match.
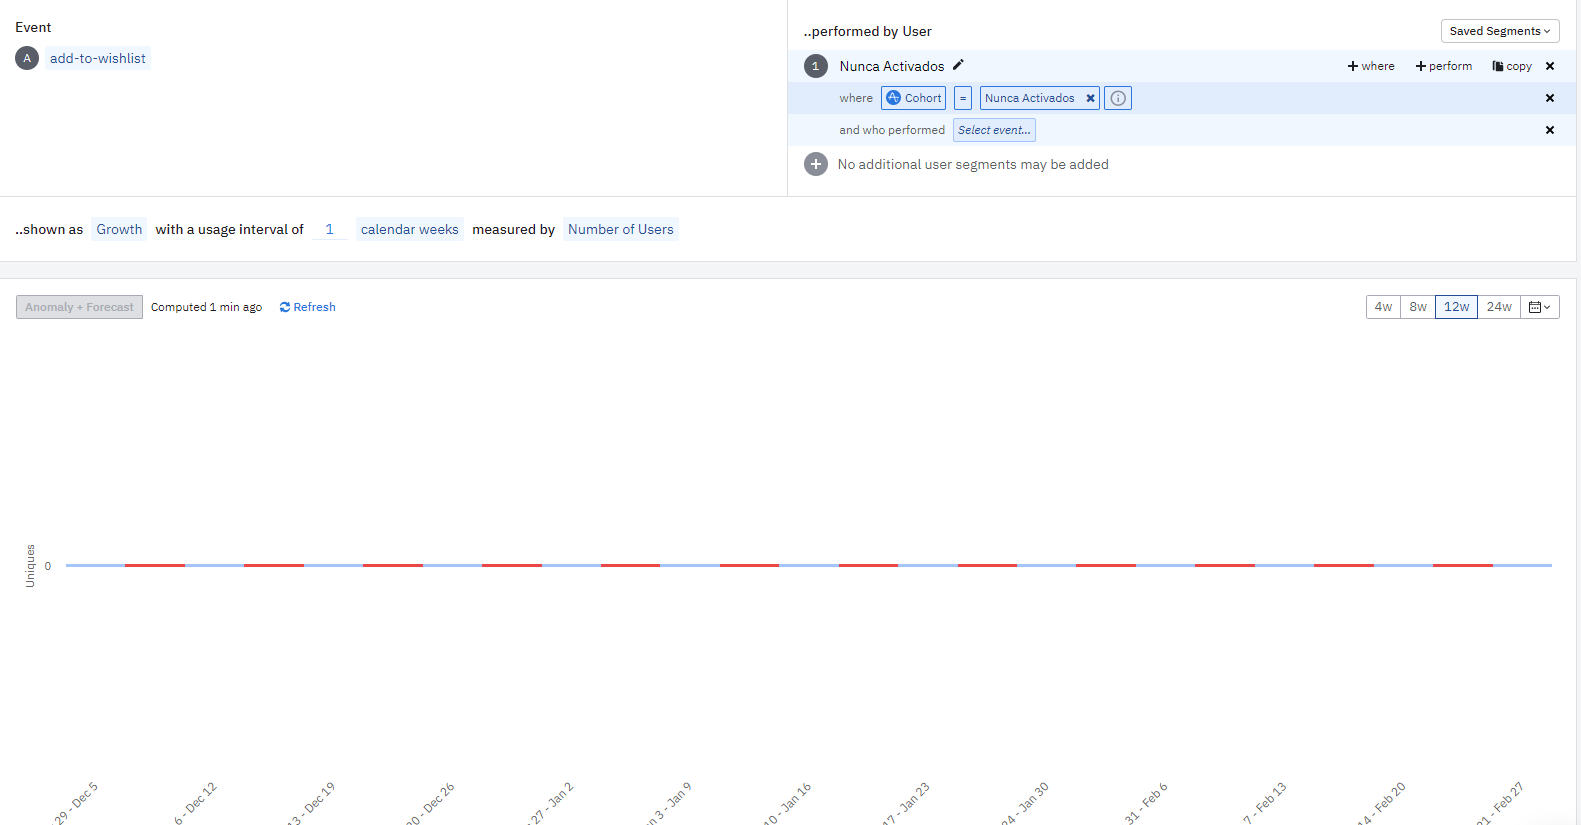
  • Using Retention graph and filtering users who created account but never did the add to wishlist event within 7 days of creating account (what we consider active). 
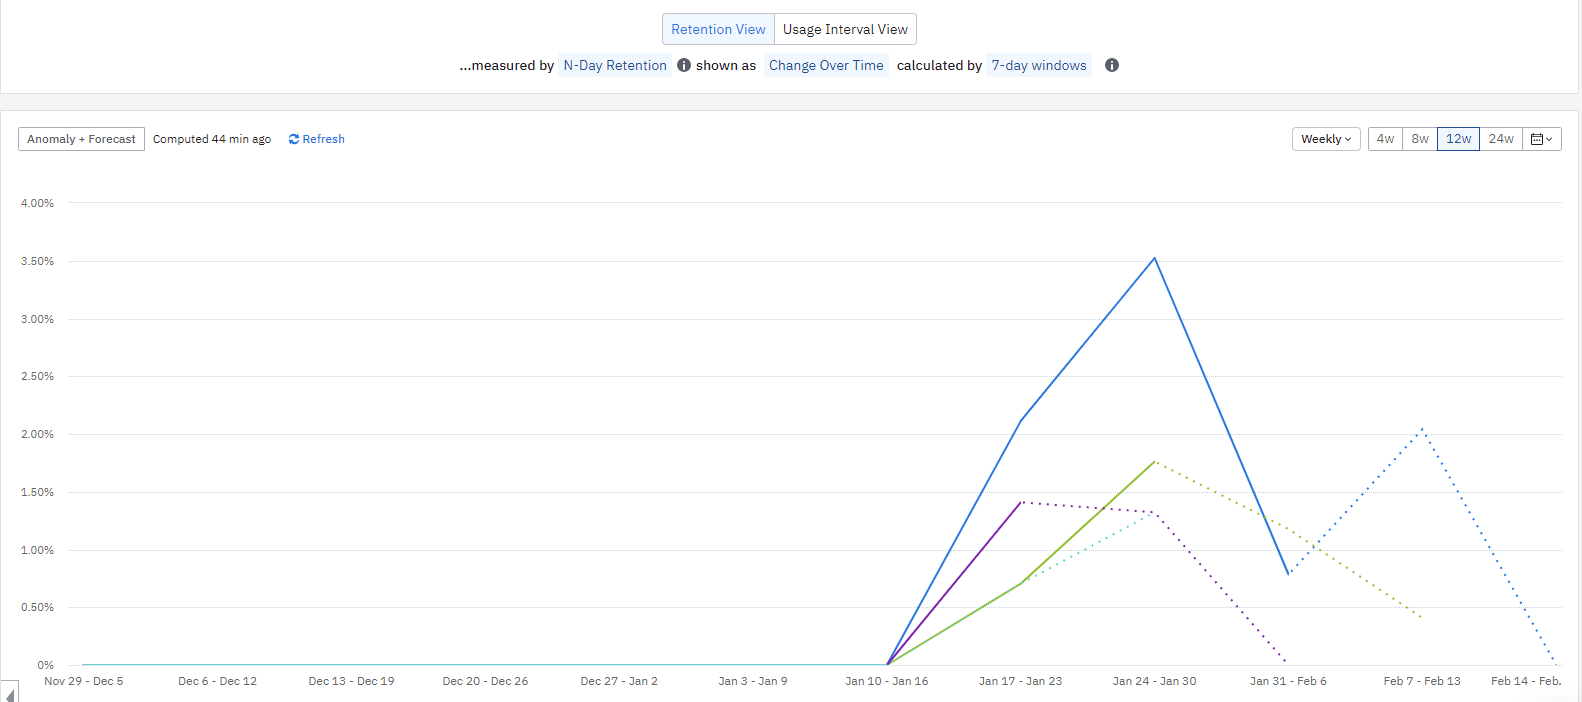
    By using retention “Change Over Time” I get a graph that shows the retention per week, but I can’t get the total number of resurrection for THAT particular week.

My original intention was to separate between Never Activated and Dormant (once activated but then churned). But without getting this right, that seems even harder.

Your help is deeply appreciated.

Thanks!

icon

Best answer by Saish Redkar 23 February 2022, 17:21

View original

3 replies

Userlevel 7
Badge +10

Hey @santiagovaldes 

Not sure if you are already using this, but creating those 2 separate user buckets as cohorts and using them in your lifecycle analysis might help.

In case you haven’t already, I tried replicating your use case in these 2 cohorts

You can tweak these definitions to better suit your use case and see if using them in your retention/lifecyle charts.

Let me know if I have understood your use case correctly here.

Badge

Thanks @Saish Redkar 

I tried adding those Cohorts, but I’m not sure how to interpret them. For example I’m using people who were active but have not been in a while:


How should I interpret the people who is new on this lifecycle? What about “current” users?

I also tried with a cohort of users who had never been active and see how much were “resurrected”, but turns out that the report is empty:


I would really appreciate your help on this, I’m not sure how to get the results I need and I’ve been trying all day.

Thanks a lot,

Userlevel 7
Badge +10

So if you are looking at your first screenshot, you will be looking at lifecycle of the cohort in there wrt only the add to wishlist event. You can read more on how to interpret new vs current users from that cohort here. You can try changing that to any active event to see if that changes the interpretation as per your use case.

In the second screenshot, the users in the cohort never performed add to wishlist in that time frame if you are using the 2nd cohort. So using add to wishlist event in the lifecycle chart on the same time frame will give empty results.

For lifecycle analysis of users who belong to cohort #2 , I would use any active event similar to this.

Hope this helps.


Reply