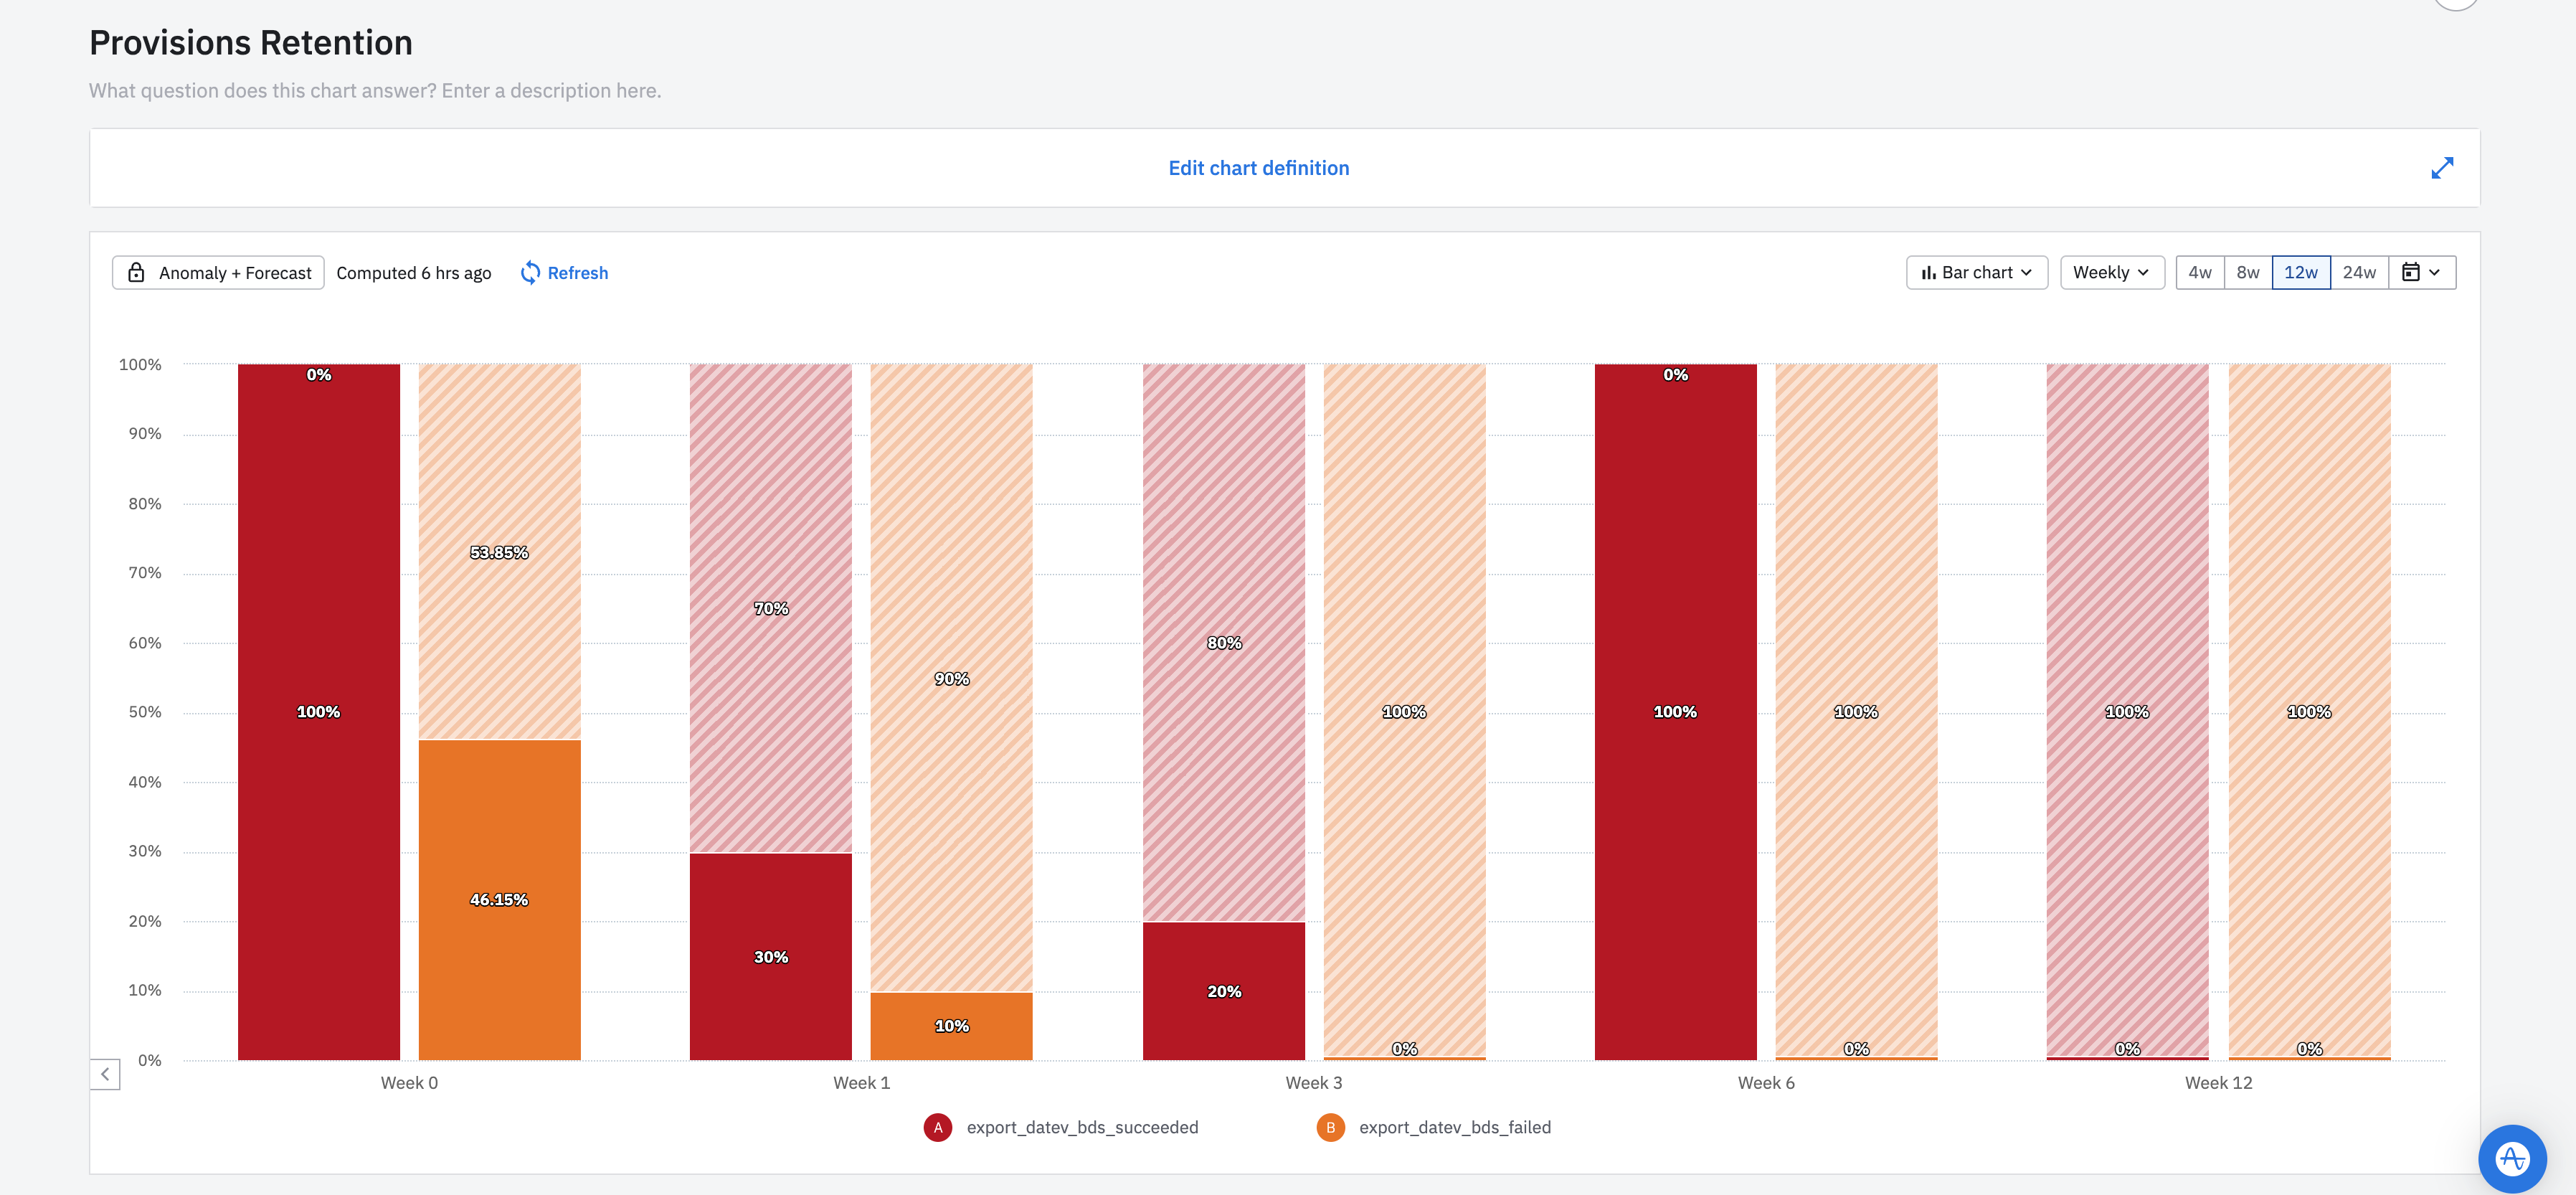
I want to build a chart with four steps
- Target population (can get done with segments)
- Adoption
- Retention
- Satisfaction
I have an adoption event, and the same event is the retention event. And I want to measure satisfaction by checking that no errors occured during that event. So it should be like
- Adopted: export_clicked
- Retained: expport_clicked
- Satisfied: export_clicked WHERE no_errors = true
This is what I got, it’s not what I want. Any ideas how can I get it done? For example, the two events are measured seperated (succeeded and failed), but it should be one step. Am I maybe using the wrong chart?


