Solved

Graphs with different timeframes in the same report

  • 29 November 2023
  • 4 replies
  • 70 views

Userlevel 1
Badge +1

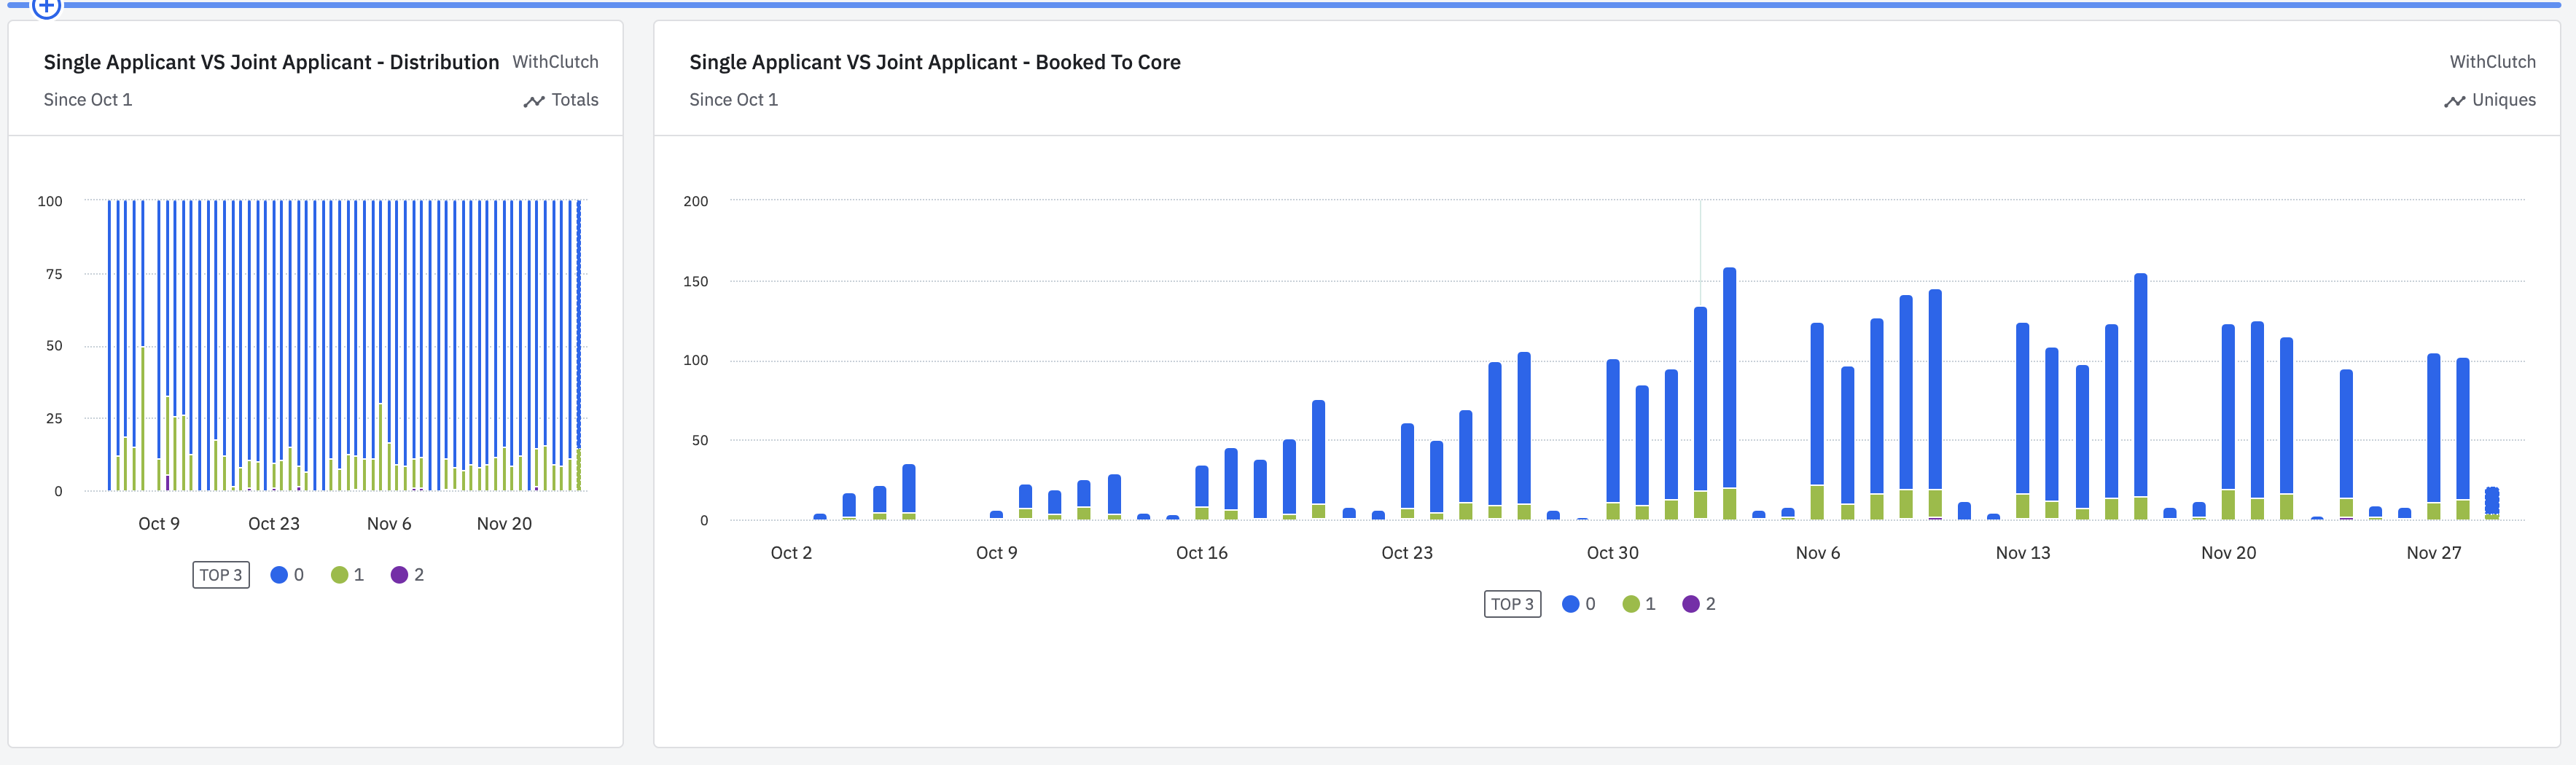
Hi there! I have a report that it contains two graphs:

  1. Daily Accounts Opened
    1. Where I group by the number of applicants in that account and show it in a bar graph
  2. All Time Accounts Distribution
    1. Where the distribution is related to the number of applicants in that account


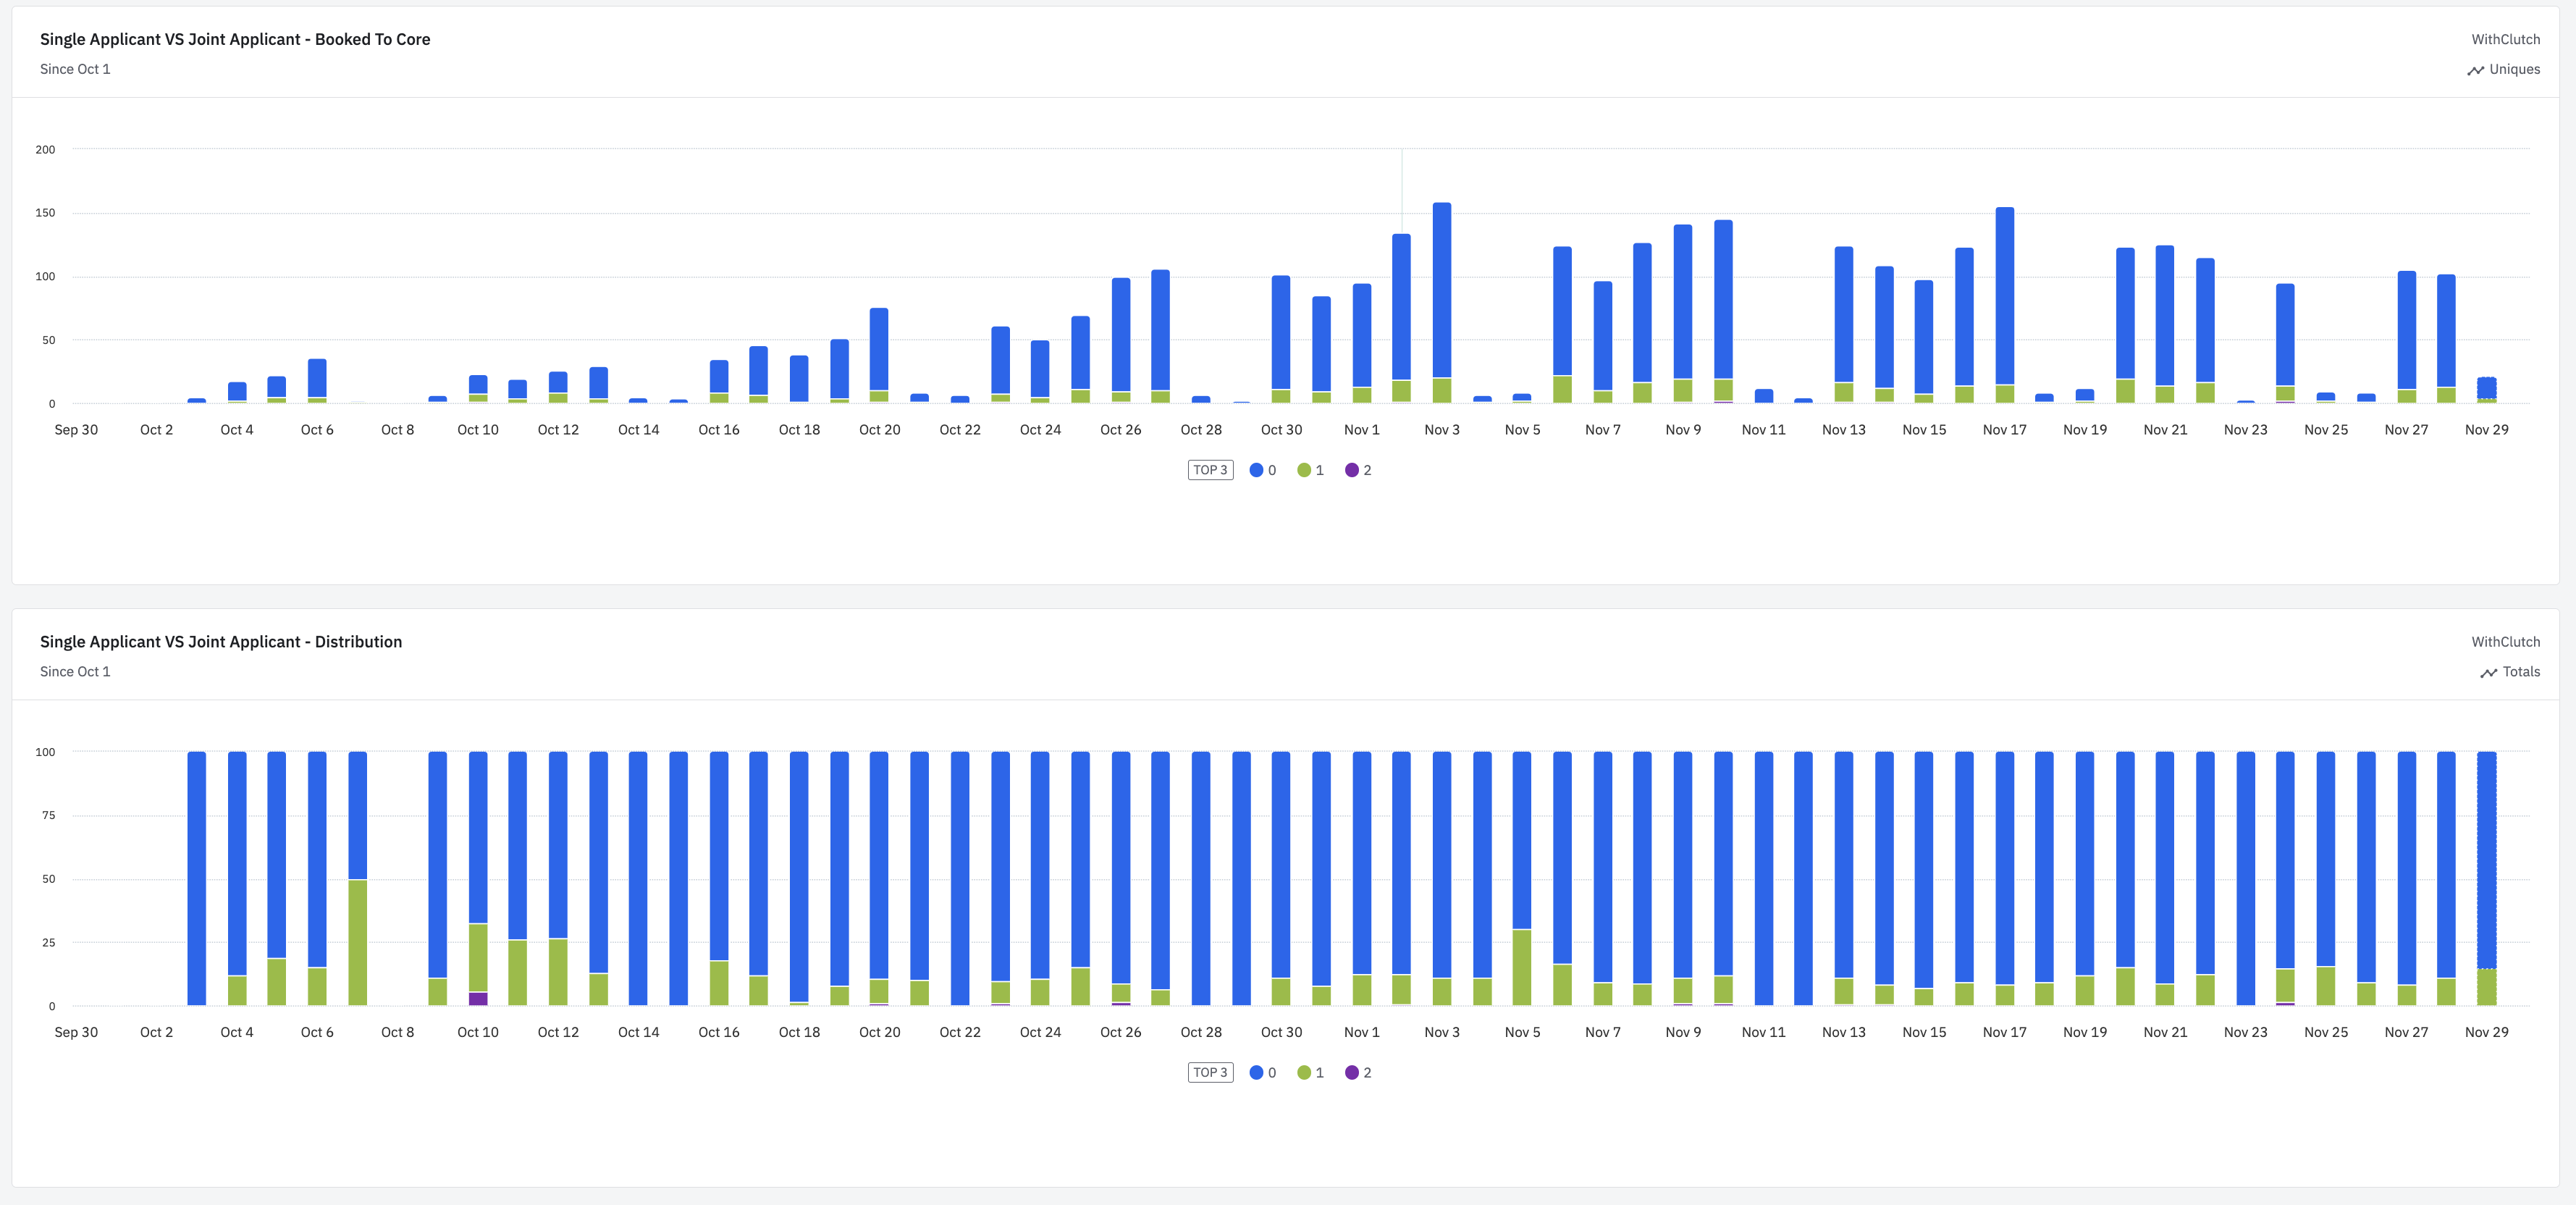
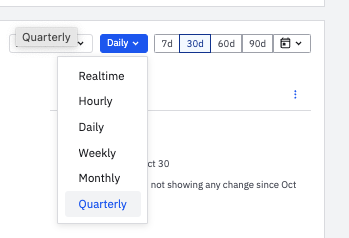
I want to show the daily performance and also the all time performance BUT my report is making all views to show as daily. I wanted the report to follow the timeframe I've set in the graph.


Is there a way to do it? Thanks in advance

icon

Best answer by Mauricio.Castro 29 November 2023, 21:41

View original

4 replies

Userlevel 7
Badge +10

Hi @Mauricio.Castro 

Not quite sure I understood your Q here. If these 2 charts are part of a dashboard, then you can change the time frame and aggregation in the Filter By panel on top of the dashboard.

Let me know if this was what you were looking for.

Userlevel 1
Badge +1

Hi @Saish Redkar ! Let me reframe it.


I'd like to the graph in the left to be Quarterly and the one in the right to be daily


Userlevel 7
Badge +10

If these are part of a dashboard, you will have to go to each chart and individually change the charting time granularity to Quarterly and then save the chart.


Userlevel 1
Badge +1

I already did that but I found the issue. If the dashboard has a custom date (ex: since Oct 1st) it will overrule whatever you've set in your graphs in terms of timeframe.

Reply